
A live satellite map that tells you when it is guessing
Space Radar draws everything in orbit where it really is, for people who have never heard of an orbital element. Why I think a map of space has to be honest and kind at once, what that costs, and why it is free and open.
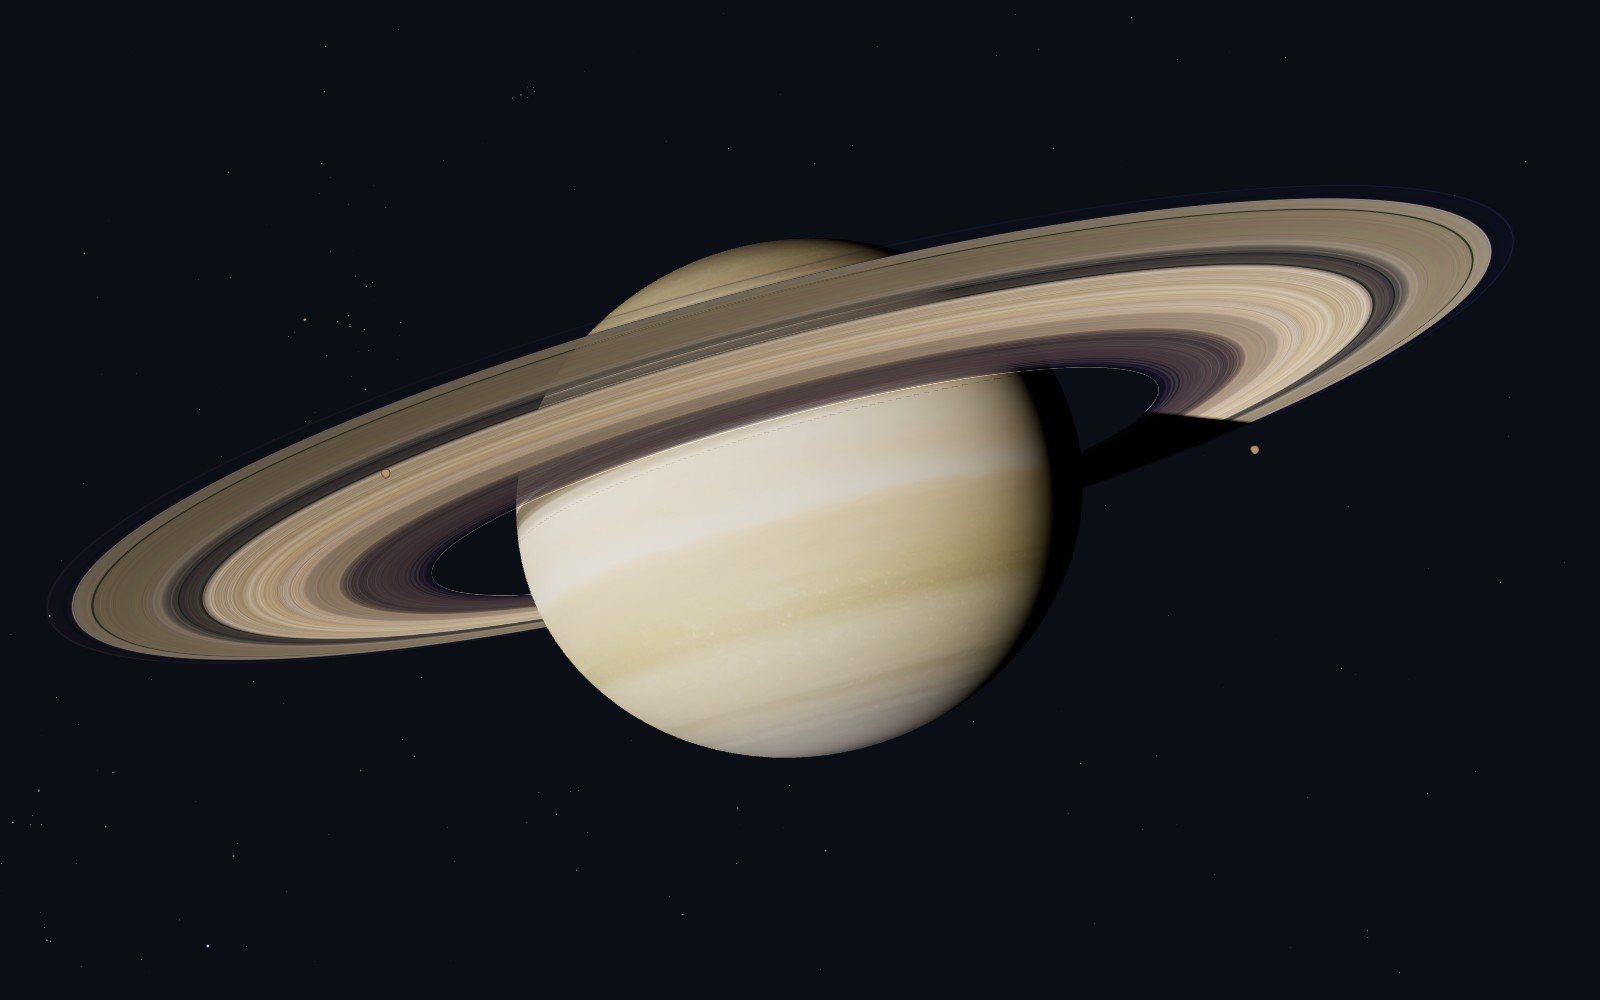
Saturn at a stop of the trip out past Jupiter. Its rings are at their measured distances; the card admits that they are drawn wider and far brighter than they are, so that they show.
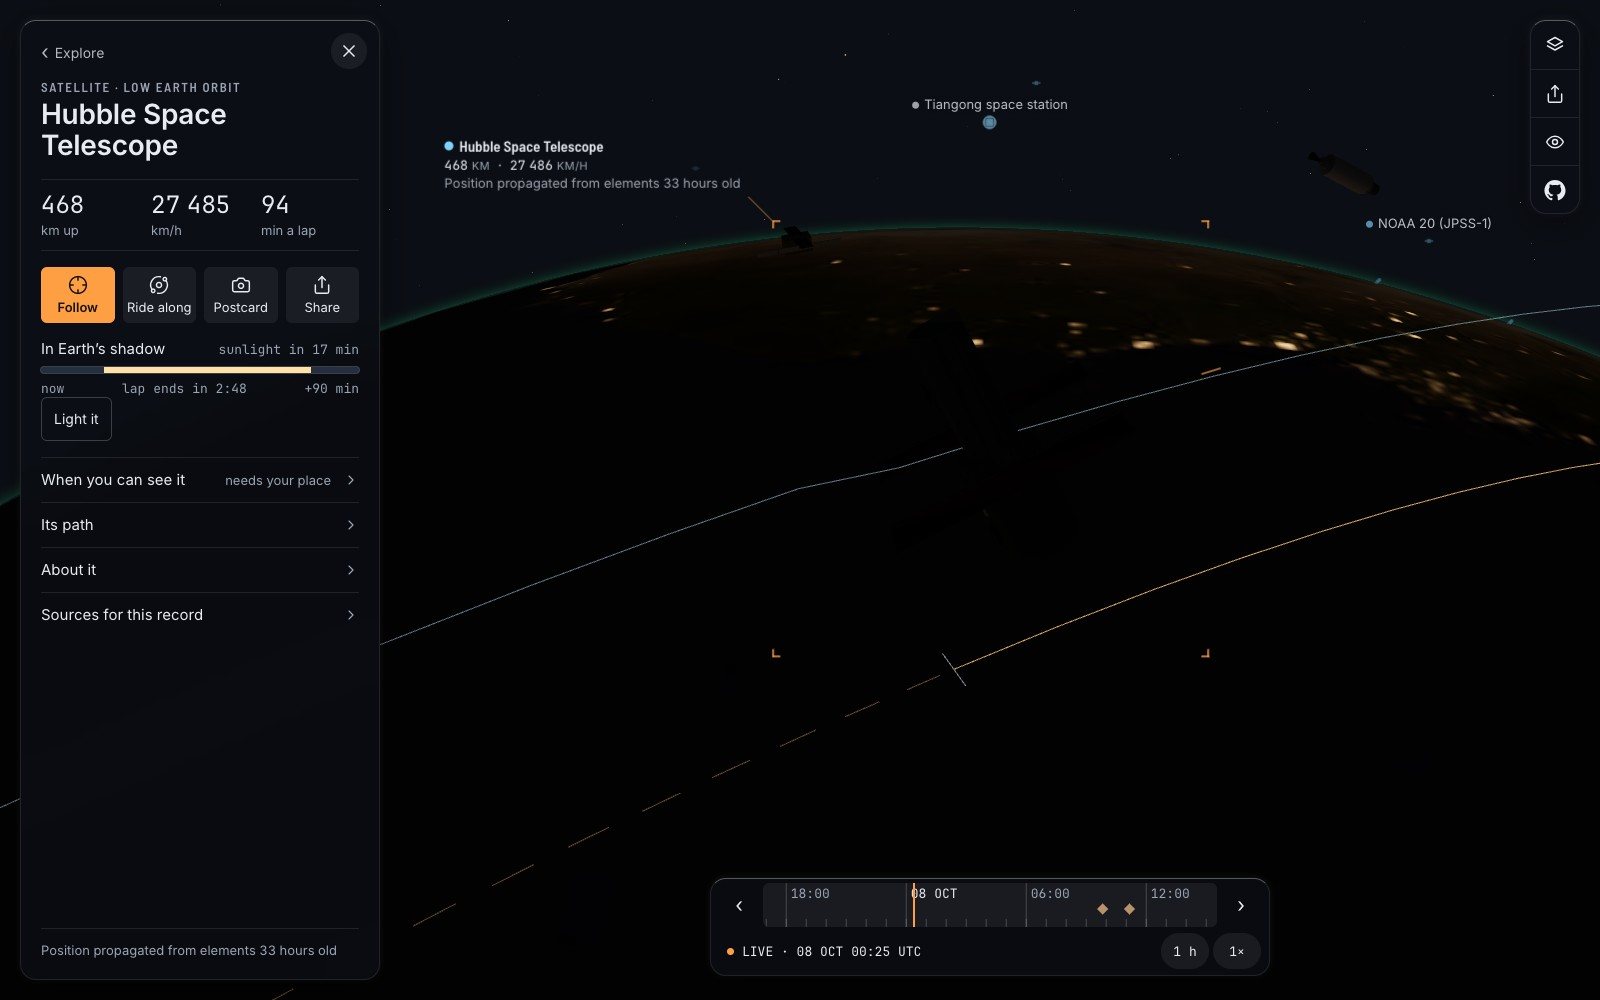
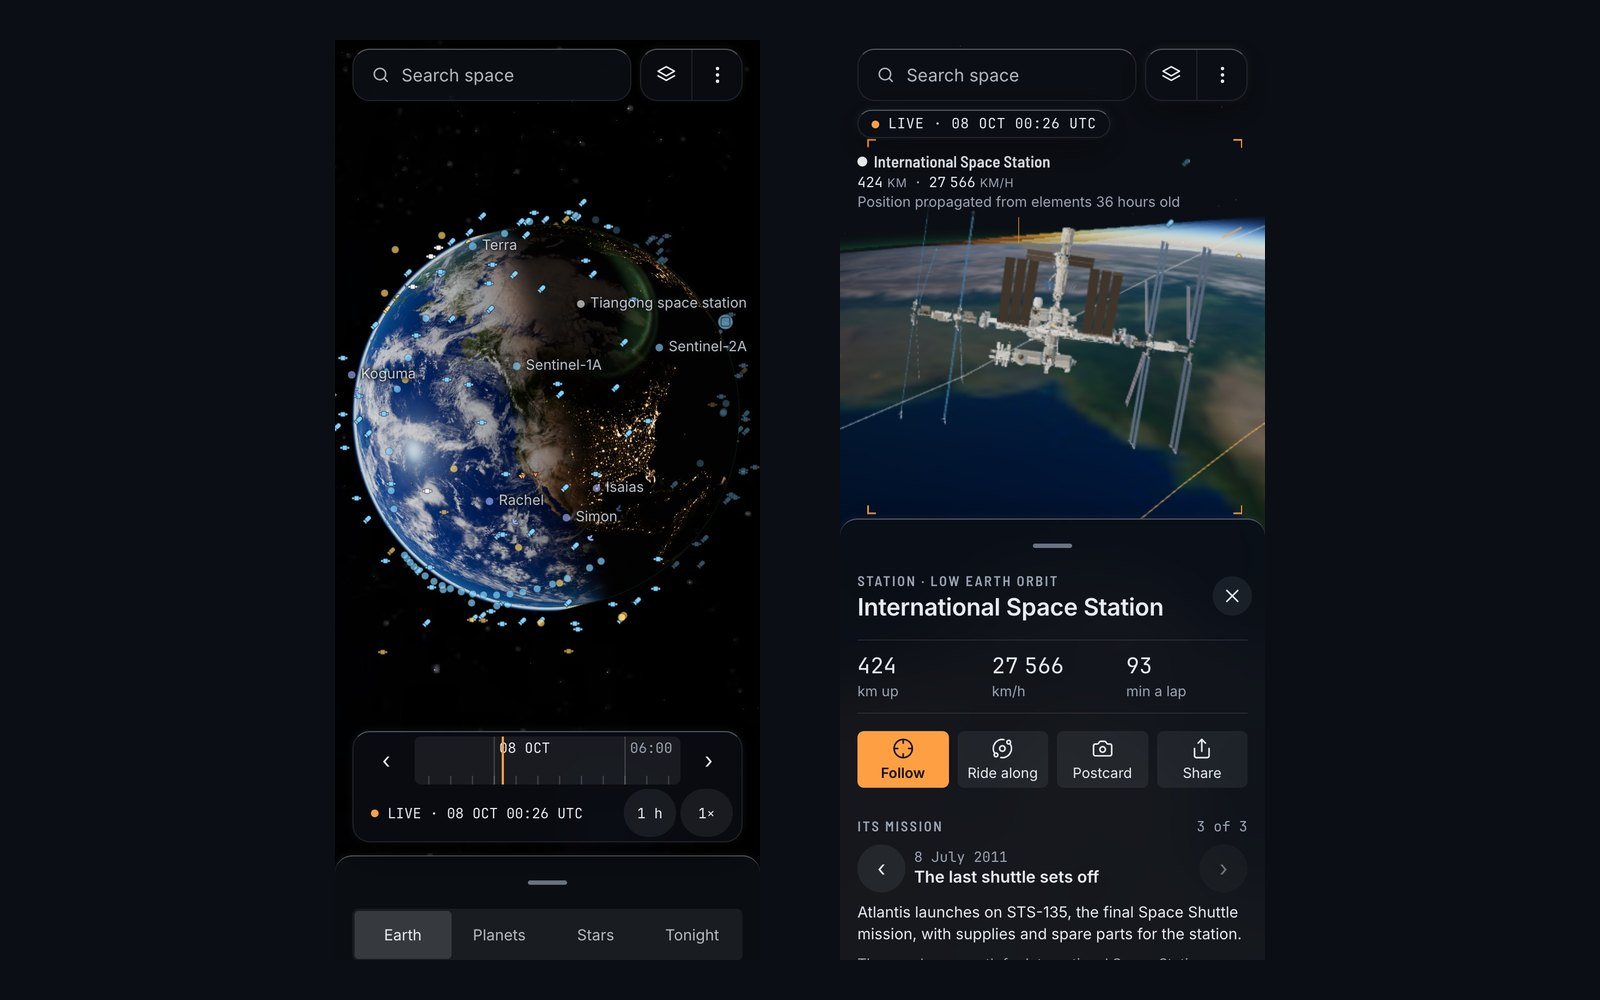
At twenty-five past midnight, Universal Time, on 8 October 2026, the Hubble Space Telescope was 468 kilometres above the night side of the Earth, moving at 27,485 kilometres an hour, and seventeen minutes away from its next sunrise. I know this because a live satellite map in my browser told me. Under those numbers, in small grey type, the same page added a sentence that most pages about space would rather not print: “Position propagated from elements 33 hours old.”
That line is a confession. Nobody was looking at Hubble at that minute. A radar had measured its orbit a day and a half earlier, and my laptop had done the arithmetic to carry it forward. The dot on the screen was a very good estimate, and the page said that it was one.
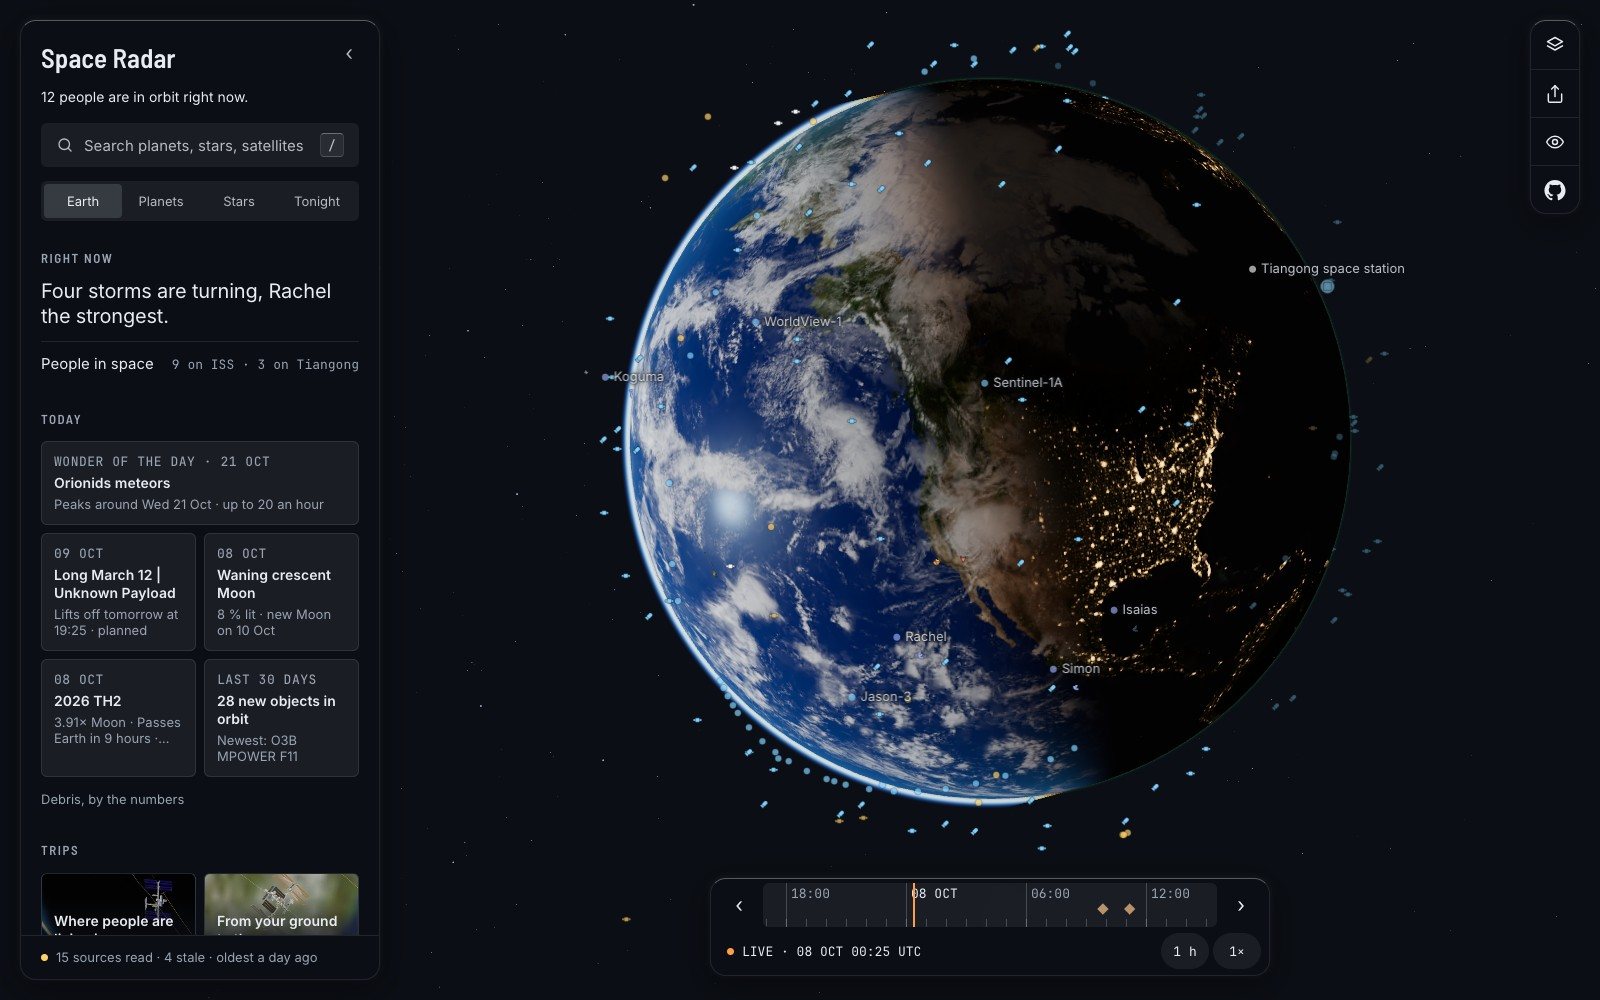
I build that page. It is called Space Radar, and it draws everything in orbit, and beyond it the Moon, the planets, the stars and the galaxy, each where it is at this second. The small grey line is the most important thing in it. This piece is about why: what it takes to show space as it really is to a person who became curious five minutes ago, and why I think the result has to be free, open, and willing to say “we do not know”.
Two kinds of space website, and the gap between them#
There have been good satellite trackers on the web for decades, and nearly all of them were built by people who already know what an element set is. It is a short row of numbers that describes one orbit: how big, how tilted, how stretched, and where on it the object was at a stated moment. The numbers come from radar and telescope tracking, and since 1985 a great many of them have reached the public through CelesTrak, the service run by the astrodynamicist T. S. Kelso. A tracker turns those rows into dots. The good ones are exact and generous, and they greet you with the words apogee, inclination and NORAD ID.
At the other end are the beautiful ones: films and apps in which space looks the way we feel it should. They are patient with a beginner. They are also, often, closed, and what they show is a picture of space more than a reading of it. You cannot ask the picture how it knows.
Between them there are things I admire. Stellarium has been an honest, open-source sky from the ground since 2001. NASA’s Eyes is a superb way to ride along with NASA’s own missions. What I could not find was one place that had the tracker’s truth and the film’s patience, for all of it at once: the satellite over your head, the rover on Mars, the star behind both.
The project’s README states the aim in three short claims. Learning about space should be free and simple. It should run anywhere. It should be honest. Everything else is a consequence.
What a live satellite map costs to get right#
Start with the arithmetic. Each satellite is moved by a model called SGP4, which goes back to the punch-card days of American space tracking and is still the one the public element sets are written for. It runs in your browser, for thousands of objects, again and again. Asteroids and comets go by Kepler’s equation. The Sun, the Moon and the planets come from an ephemeris library, which is why they are right for a date centuries away and a satellite is not.
Then the manners. CelesTrak refreshes its files every two hours and asks every program to download each file once per update; ignore that, its usage policy says, and your address goes to the firewall. So the map keeps a cache, never asks twice, and treats a refusal as an answer and not as a reason to retry. You can follow Hubble live and read at the foot of its card how old the copy is.
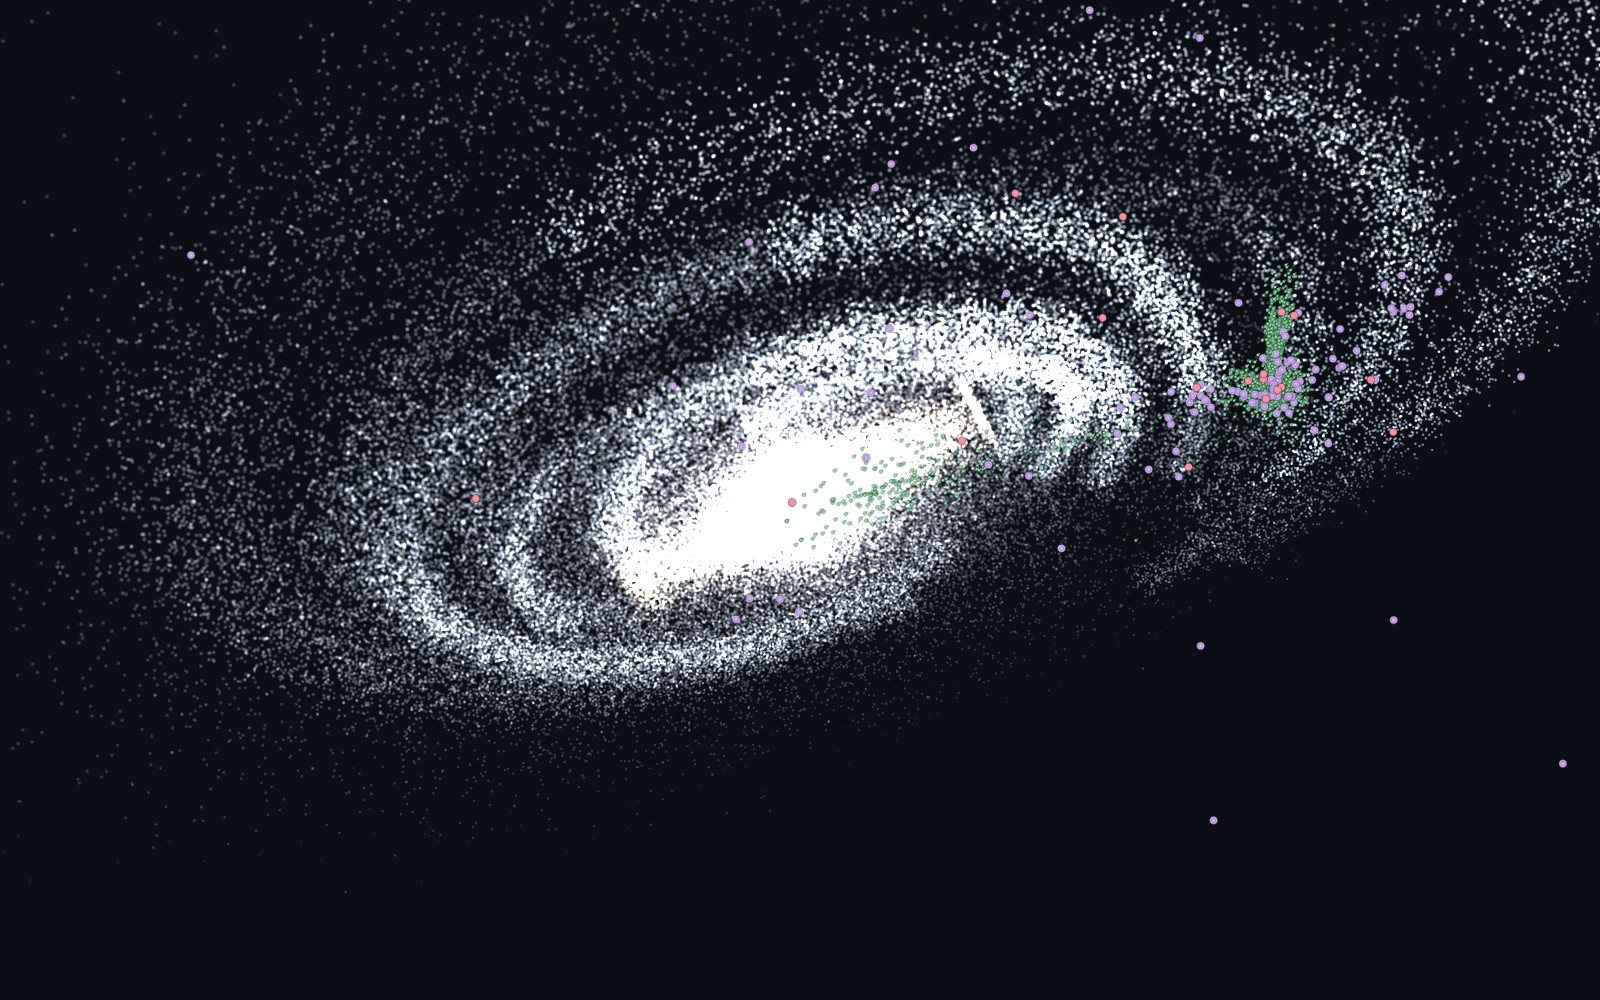
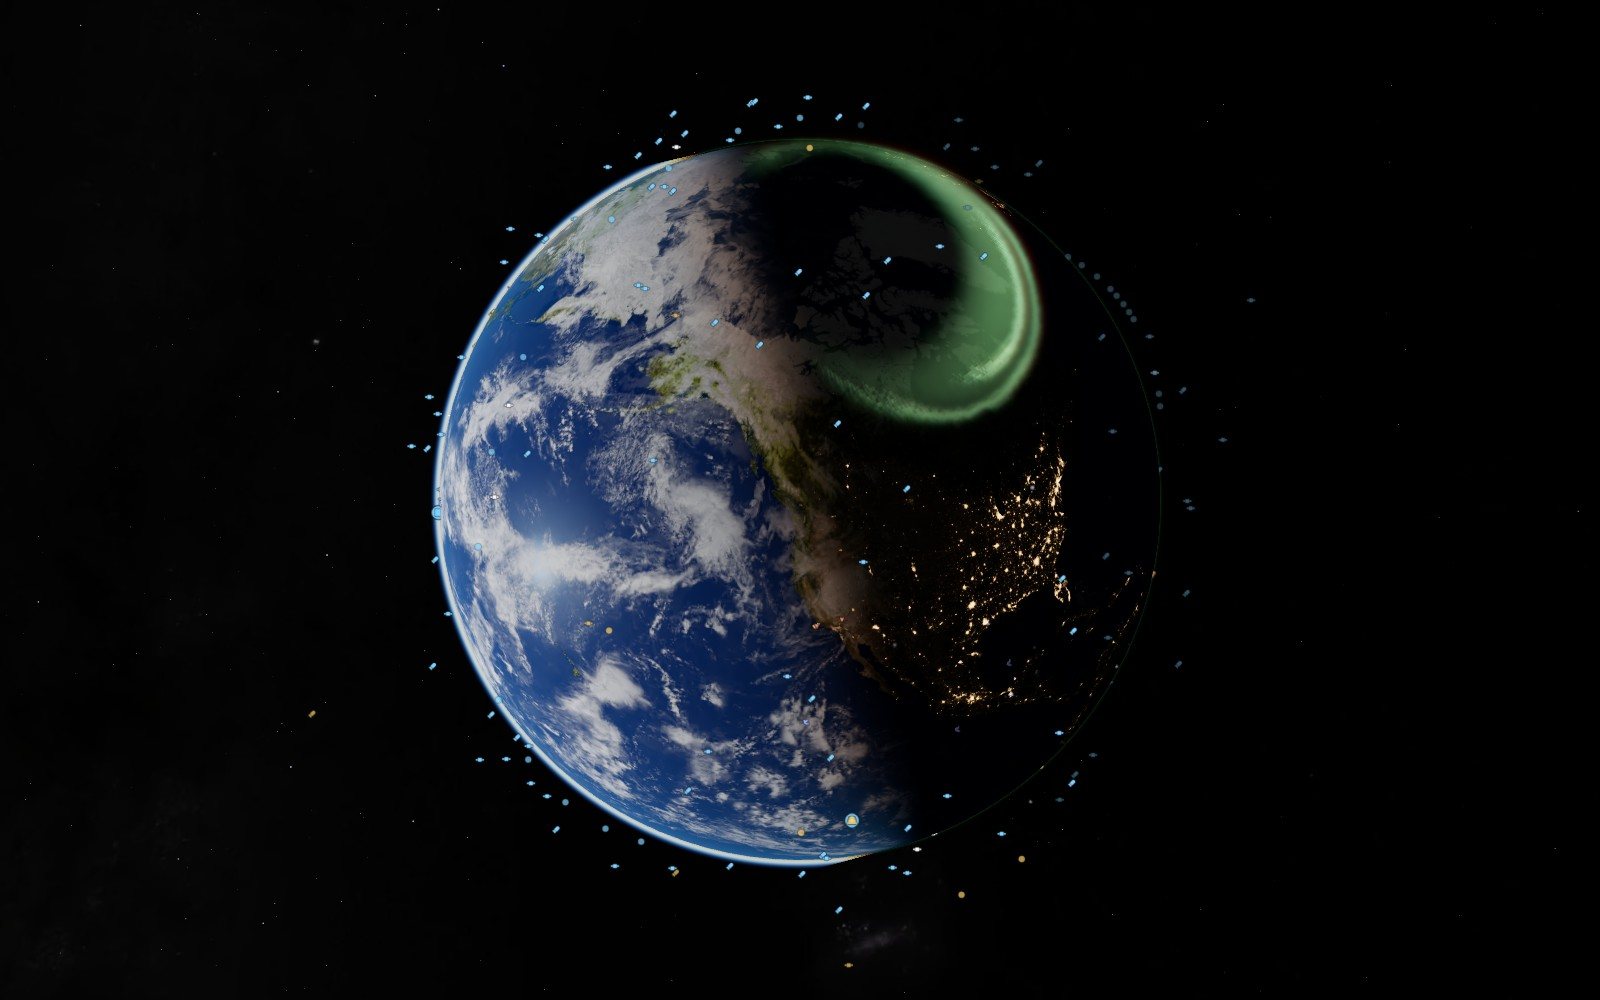
The hard part is not the mathematics. It is deciding what you are allowed to draw. The project keeps three words for this, and every card carries one of them in a line at its foot. Measured: a position worked out from a publisher’s data of a stated age. Modelled: computed from physics, with the error measured where it could be. Illustrative: a picture built to explain. The aurora on the night side is where NOAA’s forecast expects it in the next hour, and the card says “not a photograph”. The spiral of the Milky Way seen from outside is an illustration, because nobody has ever been outside it with a camera.
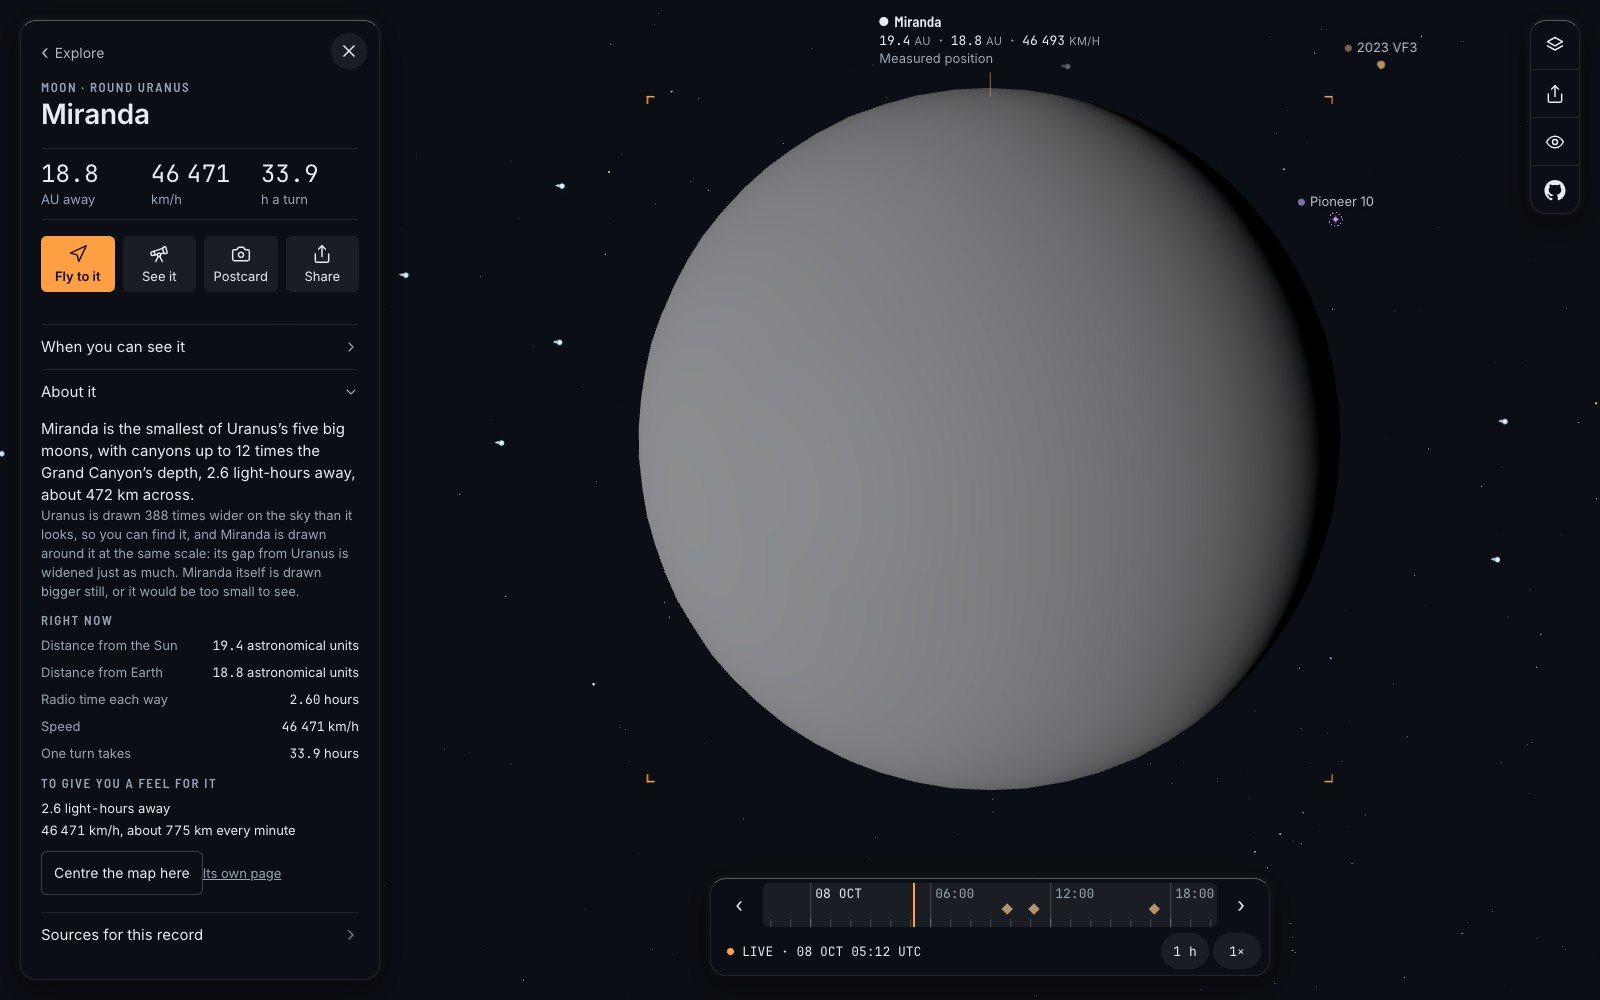
My favourite example is a small moon of Uranus. Miranda is about 472 kilometres across and 2.6 light-hours away. Drawn to scale from here it would be nothing at all, so the map cheats, and then it tells you exactly how. Its card says: “Uranus is drawn 388 times wider on the sky than it looks, so you can find it”, and Miranda “is drawn bigger still, or it would be too small to see.”
Missing is shown as missing. Never a guess dressed as a reading, never an empty layer presented as an empty sky.
That is from the project’s one-page design rules, and it has a practical edge. When a source cannot be read, the map does not show a sky with nothing in it. It says “could not look”. That is a third answer, different from “nothing there” and different from “all fine”, and a beginner deserves to be told which one they are getting.
The person who just got curious#
Honesty alone would give you a very correct table. The other half of the idea is kindness, and it is mostly made of small refusals.
A label says “Height”, not “apogee”. A card leads with three large numbers and puts the explanation one tap further in. No line of interface is longer than sixty characters. People type “station” into a search box and mean the International Space Station; the catalogue calls it ISS (ZARYA); a small file of aliases exists so that the person is right and the catalogue adjusts.
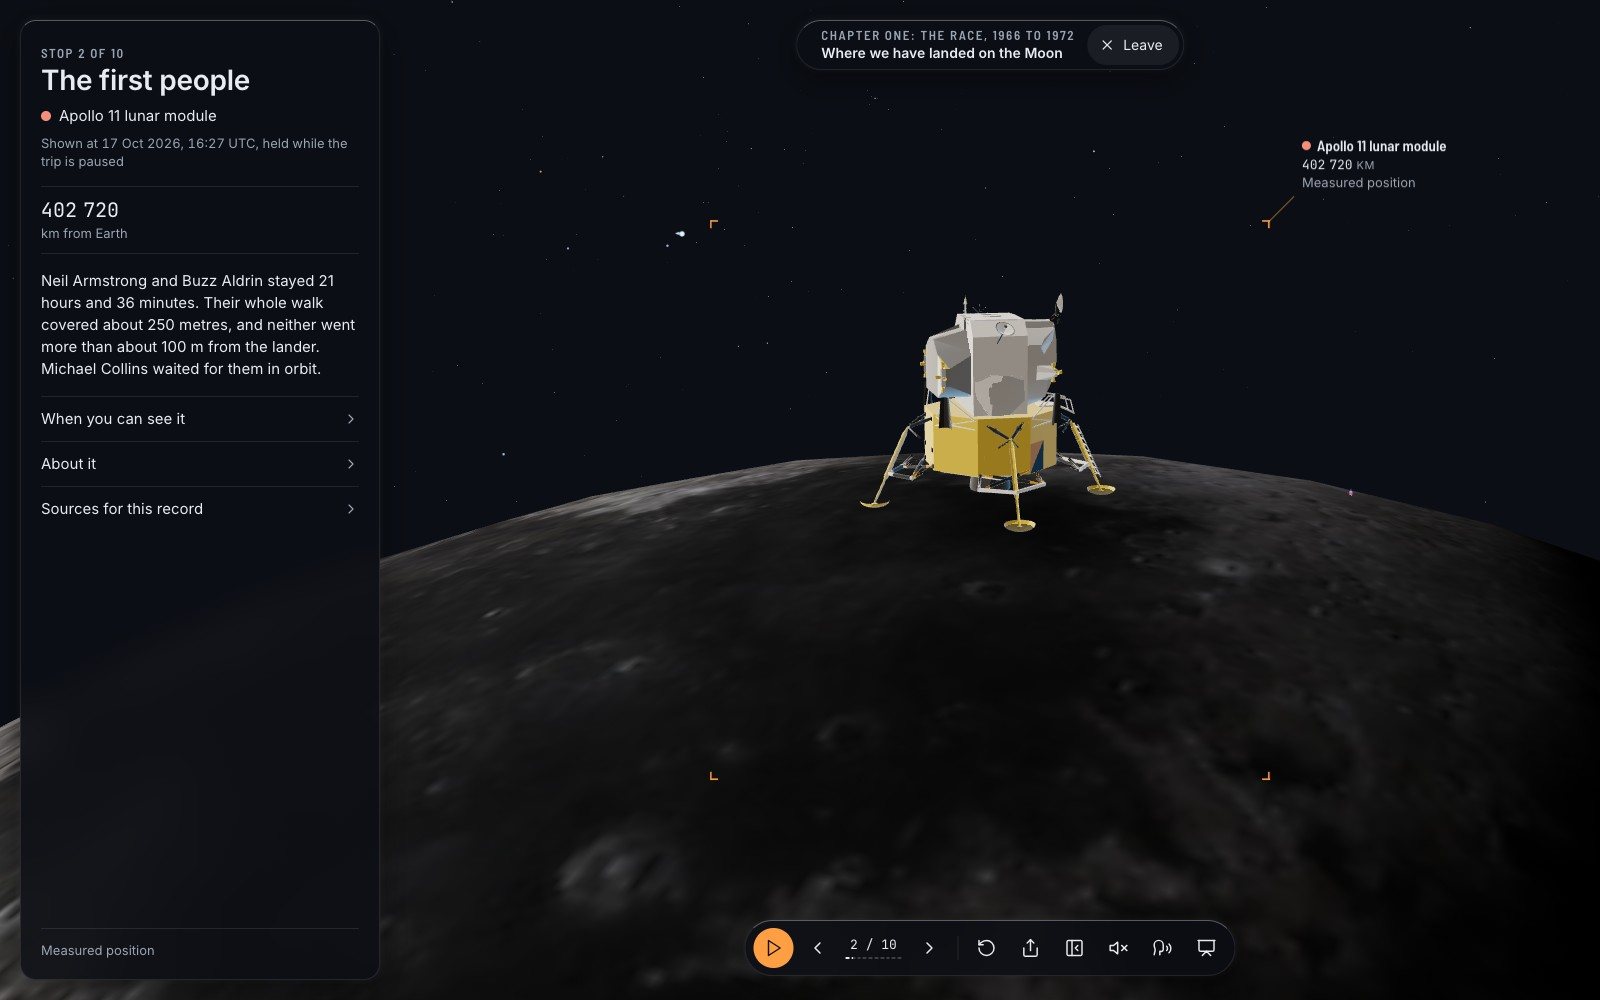
For someone who does not know what to ask, there are guided trips: 26 of them as I write, 205 stops, a little over an hour of narration. The camera flies, a voice reads one short card at each stop, and the cards are written, by rule, for a curious twelve-year-old. One trip stands you at the place where the first people landed on the Moon. Another pauses at Saturn, backlit, with its rings.
And there is the teacher in a village where the signal comes and goes. For her the project keeps a budget, enforced by a test: a first visit may download no more than 4.0 megabytes, and the stated reason is “it has to open on a school connection”. The whole thing is a folder of files that runs from a laptop with no internet at all, and when it does, it says how many days old its saved data is.
- 4.0 MBis the most a first visit is allowed to download. The reason written beside the number: “It has to open on a school connection.”
Why it costs nothing and asks for nothing#
There is no account because there is nothing to log in to. Space Radar is a static website: the page and the public data arrive, and the physics runs on your own device. No database knows you were there. No advert pays for the visit, and no tracker follows you out.
That is also what makes free sustainable. There is no server-side code to keep alive, only files. A school can put the folder on its own computer and never speak to us again.
The code is under the MIT licence, which in plain words means: copy it, change it, build on it, keep the notice. The data is not ours to license. It belongs to the people who publish it for free, and the file that lists them, with each licence and each required credit line, runs to some 1,800 lines. It ends its summary with a sentence I would like more projects to print: none of these organisations endorses Space Radar.
Built in the open, with the machines in the room#
The repository on GitHub was opened on 7 September 2026. In its first month it took in about three hundred merged changes, and the README says plainly how: much of the project was written by people working with AI assistants, “held to account by tests and by sources”.
The second half of that sentence is the one that matters. A fact on a card needs a source and the date it was read, and the automated checks refuse a row without them. Adding a moon, a landing site or a whole trip is a row in a registry of plain text files, not a change to the program, and one of the tests adds a moon of Saturn using rows alone and fails if that ever needs code.
So what the project asks of people is modest. You do not need to be a graphics engineer. The ten-minute first contribution in the contributor guide is teaching the search box one word. A report that a number is wrong, with a link to who says so, is described there as gold. So are notes from anyone who has tried it in front of a real class.
It has limits, and here they are. The interface is in English only; every word a visitor reads lives in one file, which is where a translation would start, and nobody has started one. The voice that reads the trips is synthetic and says so. Today’s clouds are real only where the weather satellites it reads can see; over Europe, Africa and the Indian Ocean they are a stand-in, and labelled as one. A satellite’s place more than a week from now is marked “rougher” on the timeline. The README still says 25 trips. And one open issue describes the Moon, up close, as “a soft painted ball”.
Where it goes next is written in the same public list. Hold the phone up and have the sky on the screen match the sky overhead. A badge that says “drawn N times larger”, with a switch to true scale. None of it is promised. All of it is where anyone can argue with it.
The grey line#
If you take one thing from this, take the habit. Open the map, tap whatever is passing over your part of the world, and read the last line on its card before you read anything else. Ask the same of every chart of the sky you are ever shown: how old is this, who measured it, and what did you make up?
Then, if a number of ours is wrong, tell us, and bring your source.
Questions people ask
Is there a free live satellite map that needs no account?
Yes. Space Radar runs in a browser, shows satellites at positions computed from public orbital data, and has no sign-up, adverts or tracking. Other free trackers exist too; most assume you know the vocabulary.
How does a satellite map know where the satellites are?
It does not watch them. It downloads published orbital elements, measured by radar and telescopes a few hours or days earlier, and computes each position forward with a standard model called SGP4.
Is Space Radar open source?
Yes. The code is on GitHub under the MIT licence. The maps, catalogues, photographs and models it draws keep their own publishers’ licences, which are listed in the repository.
Can it be used in a classroom without the internet?
Yes. It is a folder of files that any computer can serve to a browser, with a saved copy of the changing data, and it states how old that copy is.
Sources
- Repository on GitHub github.com
- Usage policy celestrak.org
- Stellarium stellarium.org
- MIT licence opensource.org
- Spaceradar.ai spaceradar.ai
- Space-track.org: documentation space-track.org
- Celestrak.org: brief history celestrak.org
- Science.nasa.gov: eyes science.nasa.gov
Explore on Space Radar
Keep reading
How accurate is satellite tracking? Follow the numbers
A map of space is a pile of other people’s measurements. Who made them, how old they are, which parts are computed, which are photographs and which are honest drawings, and how to send a correction when one of them is wrong.
A virtual space tour that begins with a family photo
A map with a legend tells you everything at once. A guide tells you one thing, then the next. On the 26 narrated trips in Space Radar, how they are written, and three of them retold.
Free planetarium software for a classroom with no Wi-Fi
Nearly half the world’s schools are not online. Space Radar is built so that one of them can keep its own copy on an old laptop and teach the sky from it. How that works, what a lesson looks like, and what it honestly cannot do without a network.