
How accurate is satellite tracking? Follow the numbers
A map of space is a pile of other people’s measurements. Who made them, how old they are, which parts are computed, which are photographs and which are honest drawings, and how to send a correction when one of them is wrong.
There is a sentence on my screen this morning that nobody wrote. It says: “The oldest thing still in orbit is Vanguard 1, launched in 1958: 68 years of laps.”
It is true. Vanguard 1 went up on 17 March 1958, and NASA still describes it as the oldest artificial object orbiting the Earth. But the sentence on the screen did not come from NASA. A small piece of code read a catalogue of everything in orbit, found the earliest launch date among the things that have not come down, and made a sentence out of it.
That is a nice trick, and it should make a careful reader slightly uneasy. Who keeps the catalogue? How old is this copy of it? What else on the page is generated, computed, photographed or simply drawn? People ask how accurate satellite tracking is as if there were one answer. There are several, and this piece follows the numbers on Space Radar back to where each of them comes from.
Somebody else’s radar#
Space Radar has no radar. Neither does any other satellite map you have used. The watching is done by the United States Space Force, whose 18th Space Defense Squadron keeps the catalogue of tracked objects and produces, for each one, a short set of numbers describing its orbit. The military’s own site, Space-Track, defines such a set as “a mathematical representation of a satellite’s mean orbit”.
Those sets are republished for everyone by CelesTrak, and that is where the map reads them. It reads them politely, at most once per update, through a copy that the project saves so that thousands of visitors do not become thousands of requests.
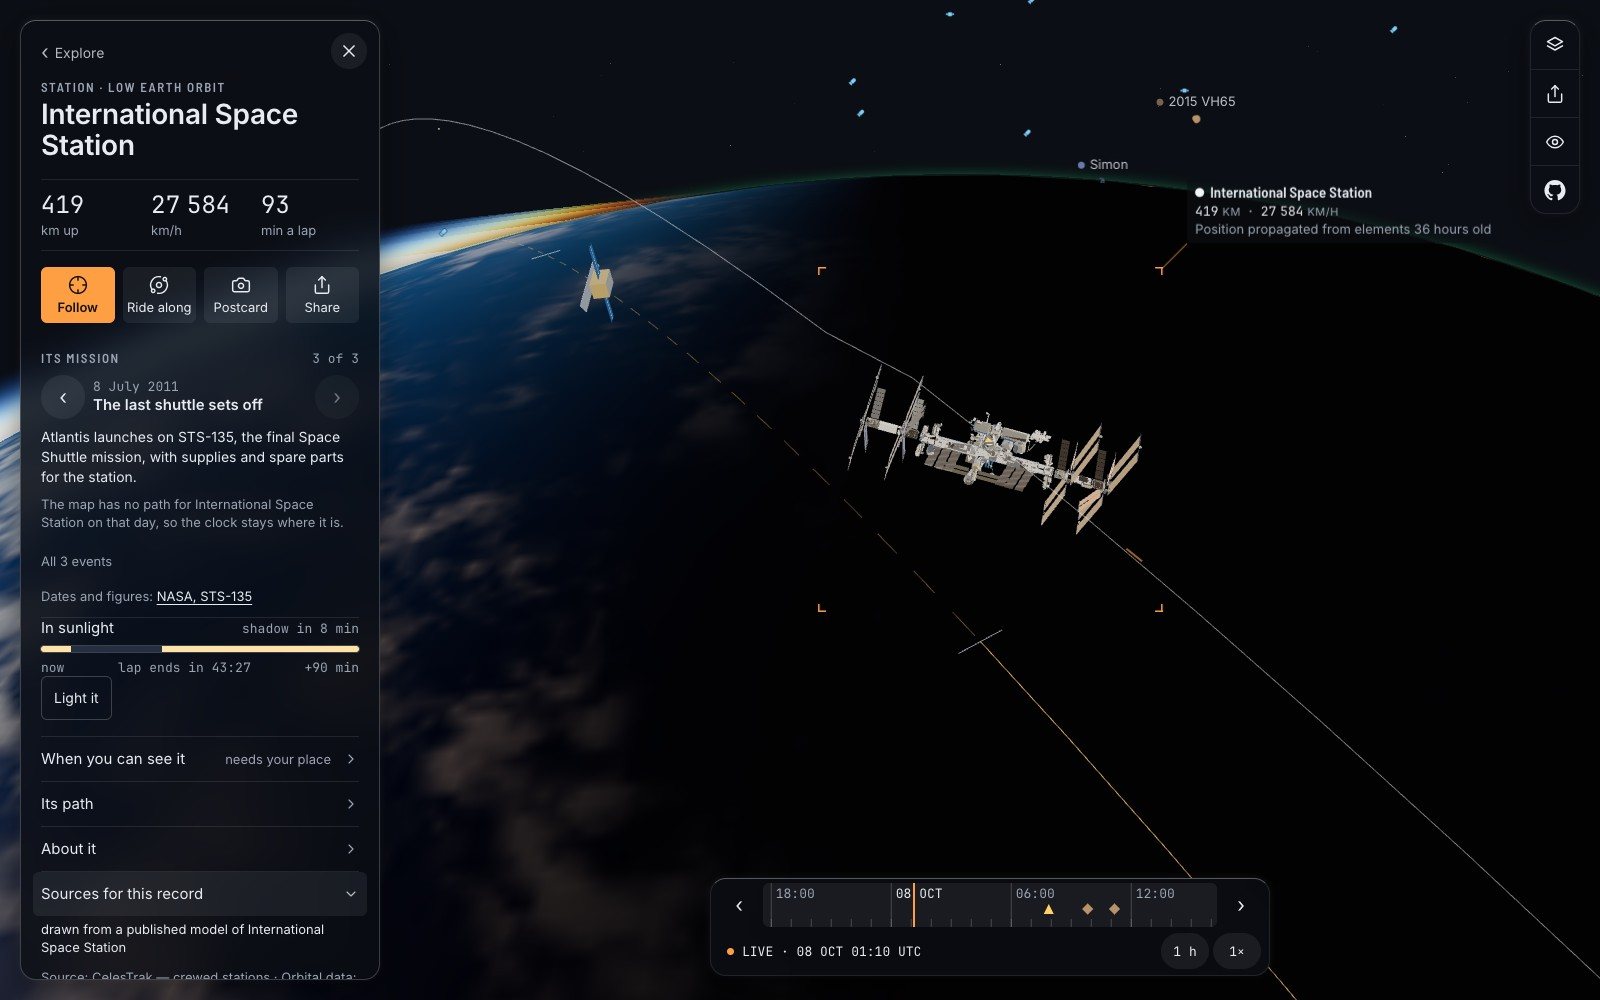
You can see the chain on any object. Open the space station’s card and tap “Sources for this record”. This morning it said, in order: that the shape on screen is drawn from a published model; that the orbit comes from CelesTrak’s list of crewed stations; and that the position was “propagated from elements 36 hours old”.
Even “measured” is generous#
So how accurate is the dot? The honest answer has two parts.
Near the moment the numbers were made, quite good. For a typical low orbit the standard model is reckoned to be right to about a kilometre within a few days. For something moving at nearly eight kilometres a second, a kilometre is an eighth of a second.
After that it decays, and not gently. A low satellite ploughs through thin air that nobody can forecast well, and the error grows by something like a kilometre a day, faster for small light things. This is why Space-Track itself warns that its public numbers are not good enough for deciding whether two objects will collide.
The map’s own code is blunt about the vocabulary. A position is labelled “measured” only within twelve hours of the day its numbers were made, and “worked forward from an older measurement” after that. Above the line that sets the twelve hours, a programmer has left this:
A TLE is a fit, not an observation, so even “measured” is generous.
A TLE is the old two-line format of those orbit numbers. The comment is right. No radar saw the station where the dot is. Radars saw it in several places some hours ago, a curve was fitted through them, and your browser has extended the curve.
Two counts that disagree, and are both right#
Now the big number. How many things are up there?
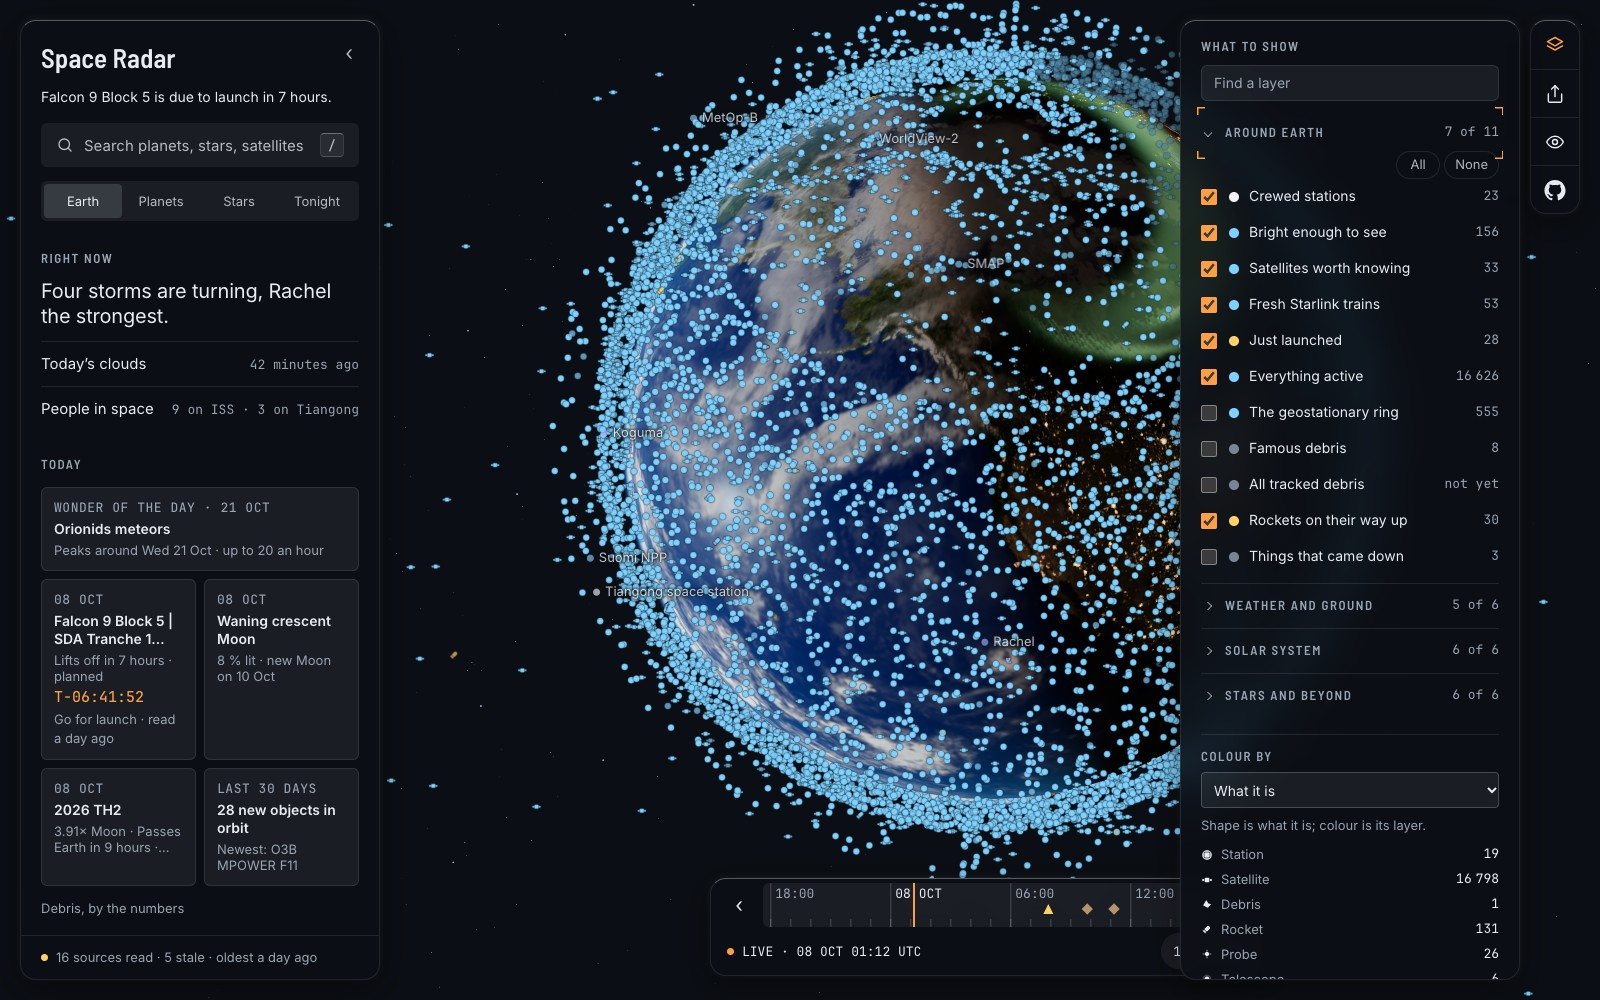
On the home screen there is a quiet link, “Debris, by the numbers”. Tap it and the map reads CelesTrak’s whole catalogue and counts. On 8 October 2026 its answer was: “17 450 of the 34 570 things tracked in orbit no longer work.” Of the rest, 17,066 were working satellites, and one stop of a trip shows all of them at once.
The European Space Agency, whose debris office publishes its own figures, gives a different total: about 47,140 objects regularly tracked, and about 15,900 satellites still functioning, as of its update of 31 July 2026.
Neither is wrong. They are counting on different days, from different lists, with different rules for what counts as catalogued and what counts as working. A map that printed one of them without a date would be hiding that. The panel prints where its count came from and when: “Counted from CelesTrak’s catalogue as read on 6 October 2026: what radar can track, from about 10 cm across.”
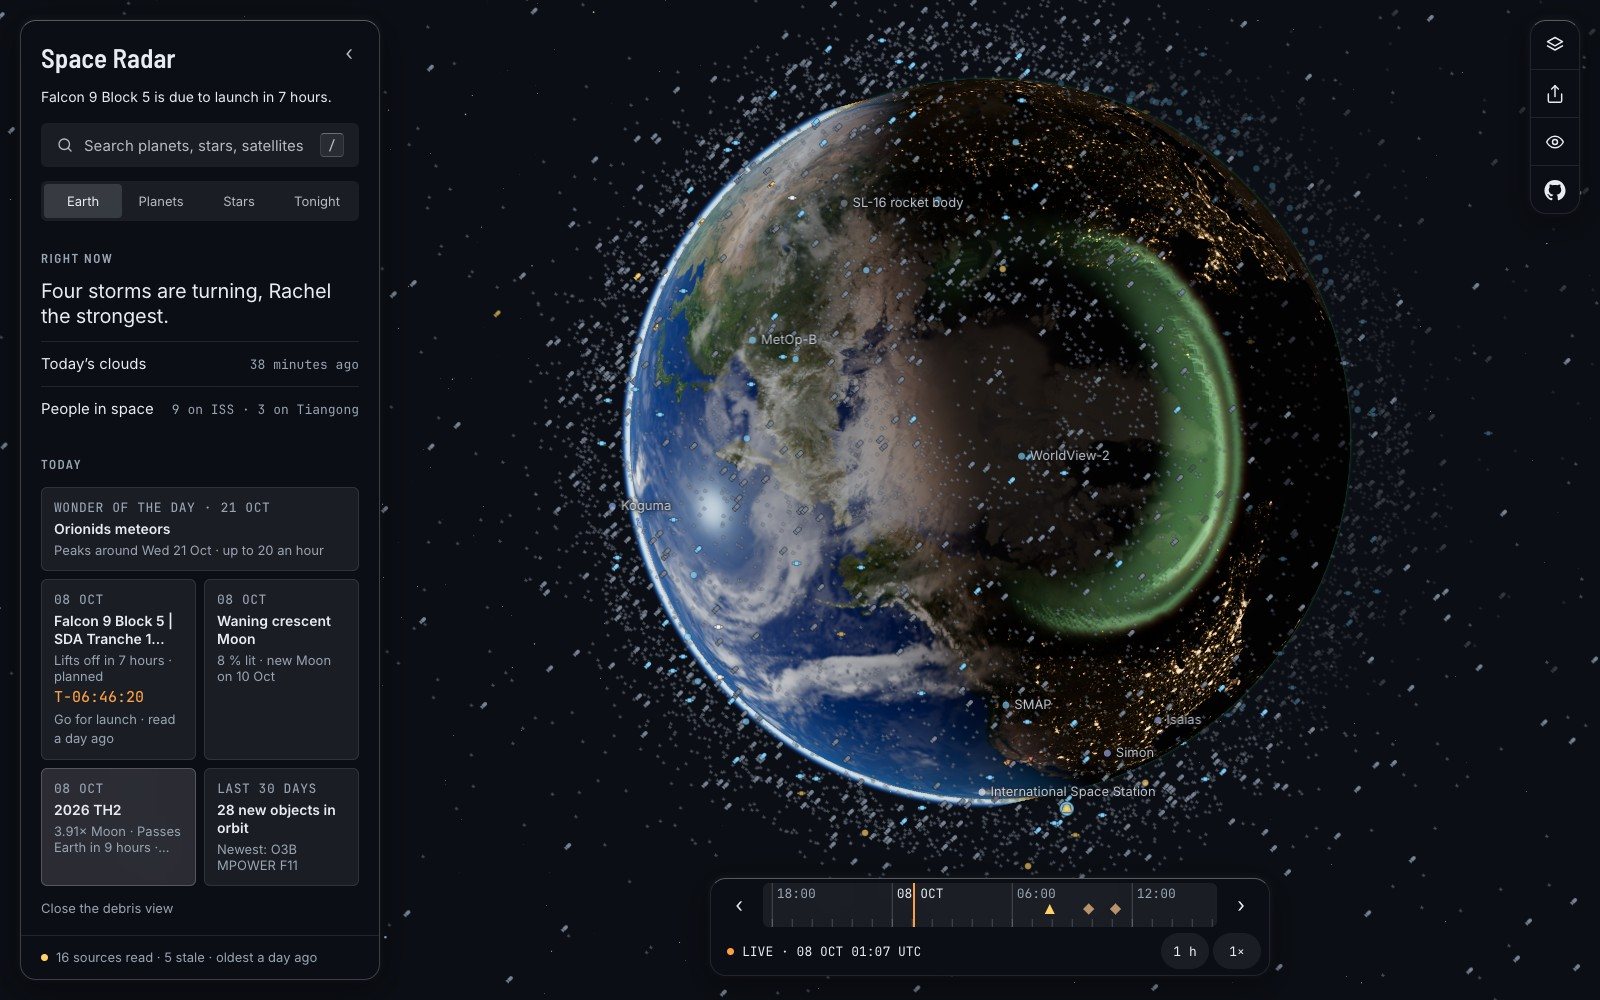
That caption deserves a second look. The catalogue the count is made from gives each object’s orbit but not where on the orbit it is this minute. So the dots are in the right shell, at the right tilt, at an invented point along the way. A prettier map would not have mentioned it.
Smaller pieces are not in any catalogue. The panel quotes ESA’s model for those, about 1.5 million pieces between one and ten centimetres, and adds four words: “An estimate, not a count.”
- 34,570things tracked in orbit, by the count the map made from CelesTrak’s catalogue on 6 October 2026. ESA, counting differently, says about 47,140.
Computed, catalogued, photographed#
Satellites are the shakiest numbers on the map. Almost everything else is firmer, and it helps to sort it into three piles.
Computed. The Sun, the Moon, the planets and their moons are worked out afresh for the instant on the clock, from physics that holds for centuries. Nothing is downloaded. An eclipse in 2028 is as trustworthy as the Moon tonight.
Catalogued. The stars are a list somebody measured. The 109,389 stars the map draws in three dimensions come from a public compilation built on the European satellite Hipparcos, and the build script says exactly what it kept: 119,614 rows in, and 10,224 of them “counted and not drawn” because nobody has measured their distance. Fainter stars might have come from Europe’s newer Gaia catalogue. They do not, and the credits file explains why: Gaia’s archive forbids commercial reuse, the project ships nothing under such a licence, “so nothing was downloaded”.
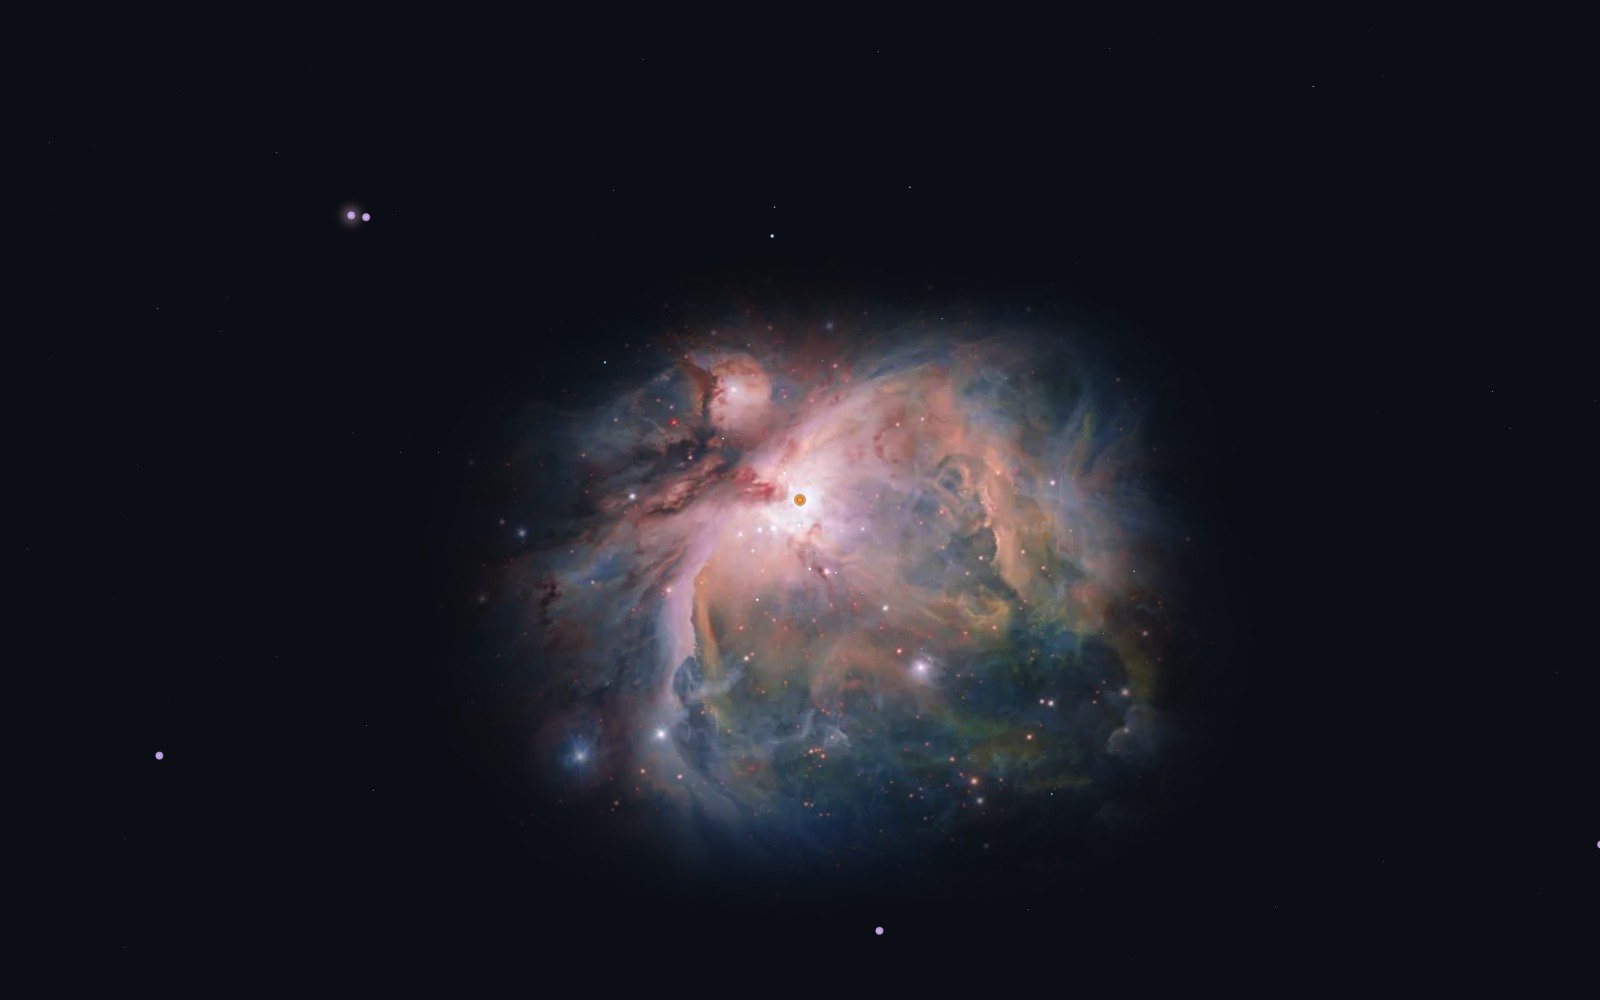
Photographed. Thirty nebulae and galaxies on the map are real photographs, placed where the objects are in the sky, from the European Southern Observatory, the Hubble and Webb telescopes and America’s NOIRLab. Each carries a line under it. For the Orion Nebula it reads: “A real photograph, placed where it is in the sky. Picture: ESO/G. Beccari · CC BY 4.0, edges faded and sky darkened by us.”
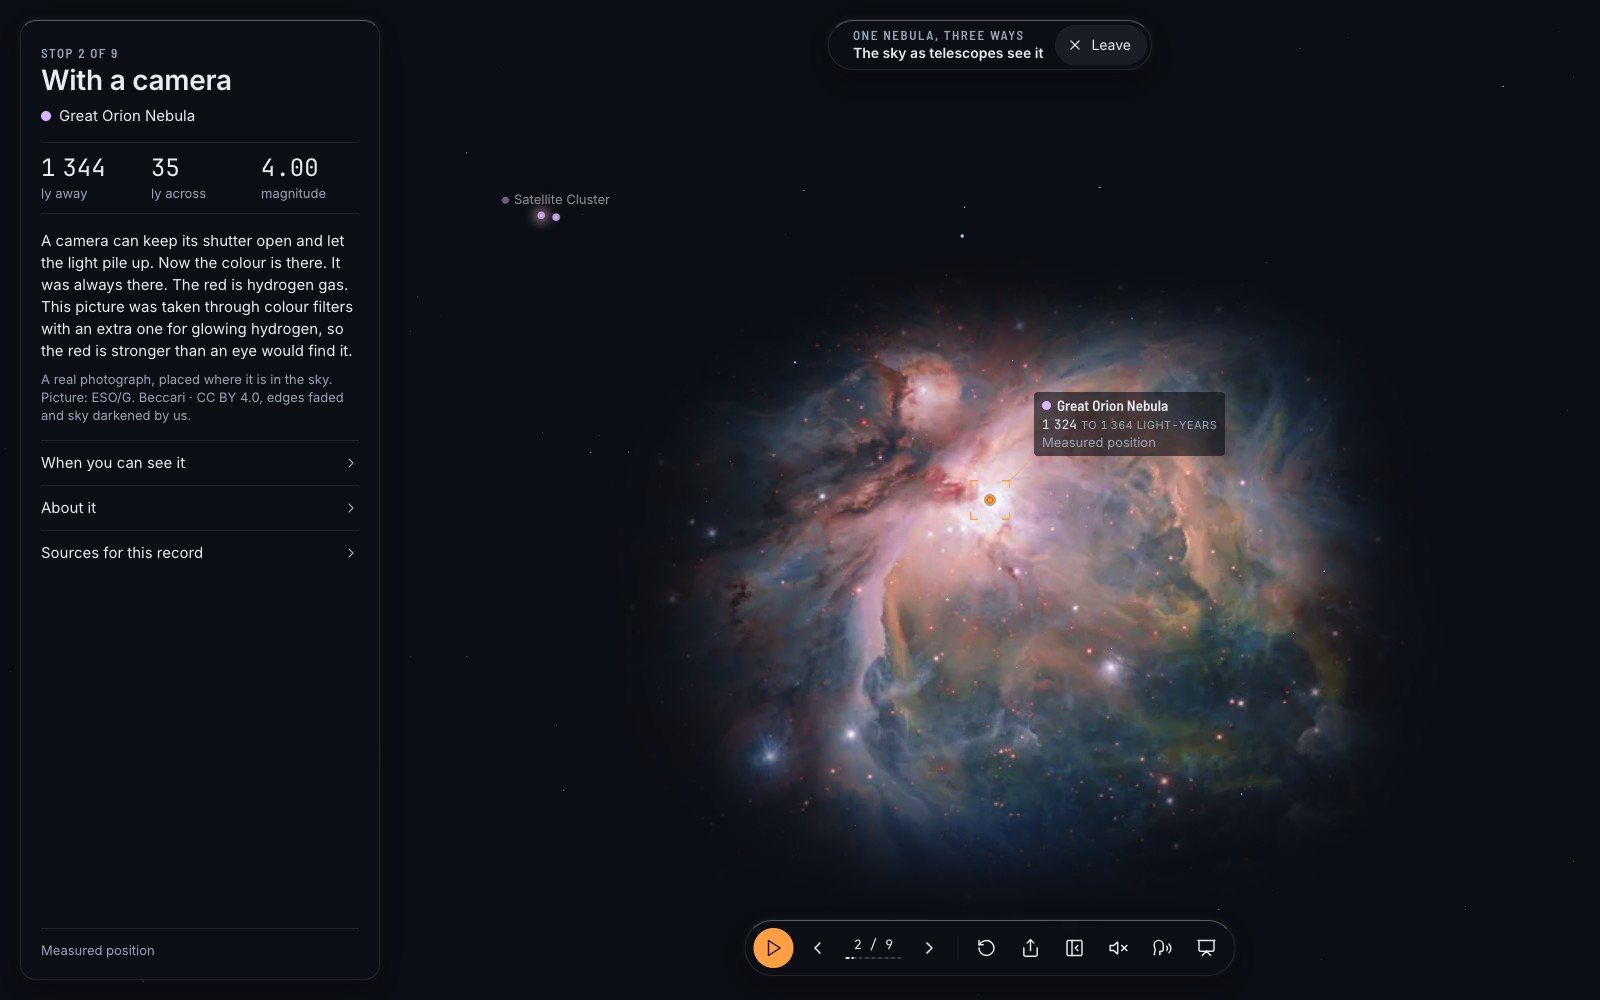
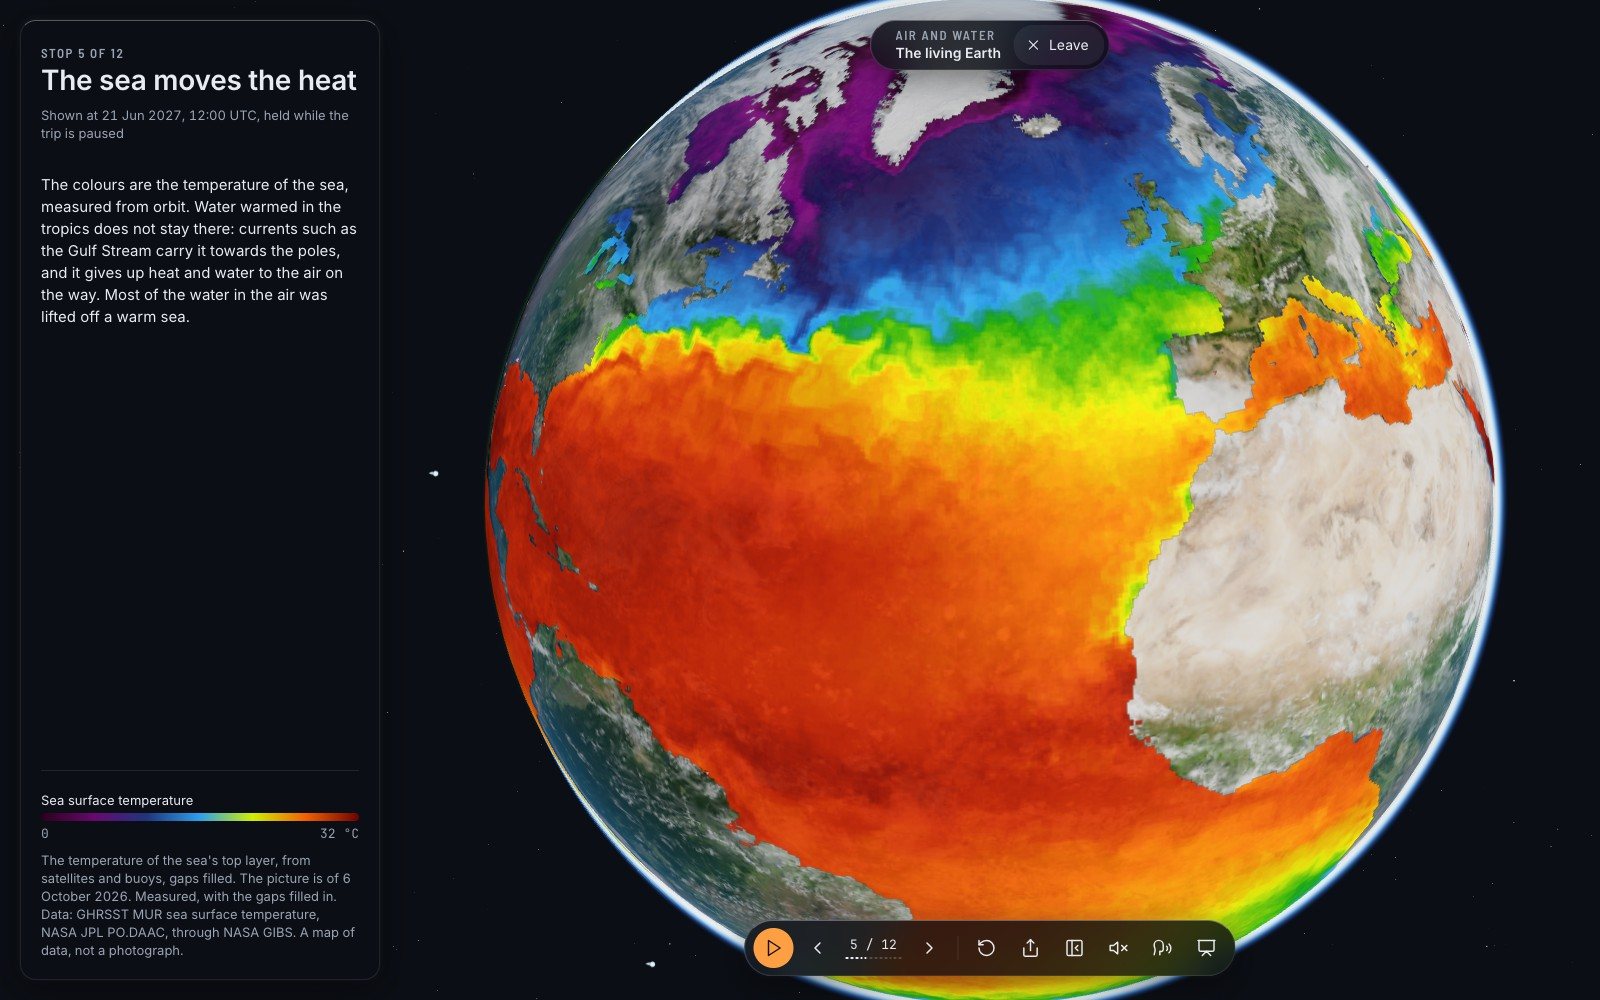
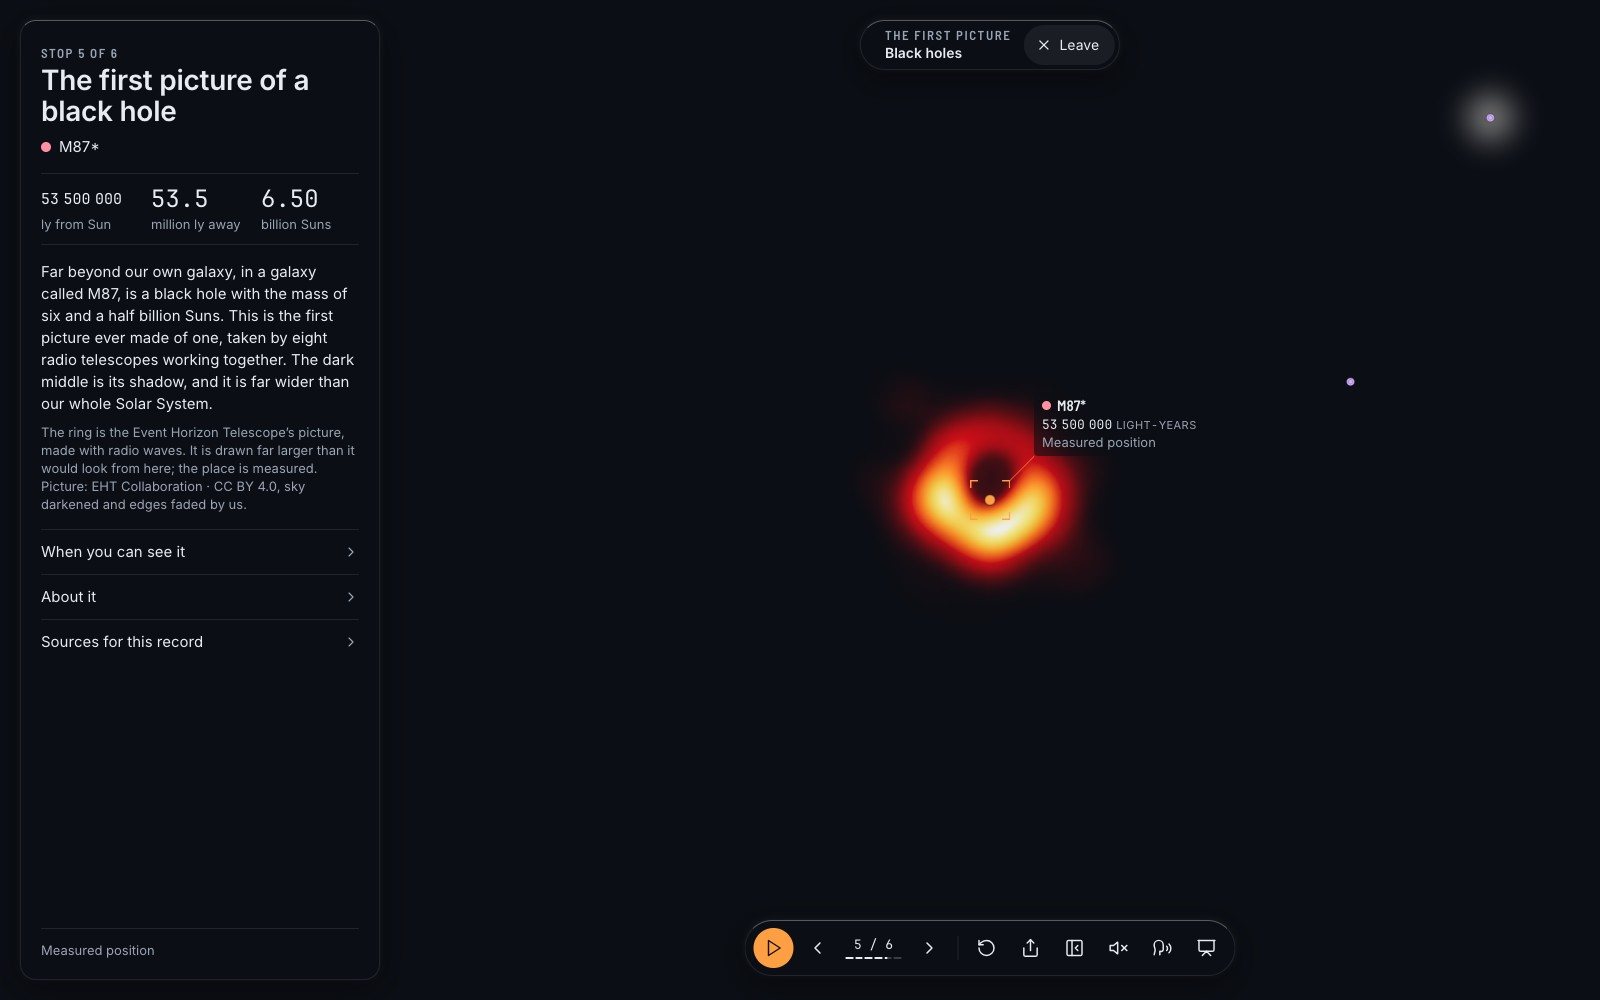
And then there are things that look like photographs and are not. The map takes care over those. The colours on the sea in the living-Earth trip are temperatures: “Measured, with the gaps filled in… A map of data, not a photograph.” The glowing ring of the first black hole ever pictured is the Event Horizon Telescope’s own image, made with radio waves, and its card adds: “It is drawn far larger than it would look from here; the place is measured.”
The page that says how it is doing#
All of this would be easy to promise and quietly let slip. So there is a panel that reports on the map itself. It opens from the line at the foot of the sidebar, and its first sentence is: “Every source it reads, how old that reading is, and where it comes from. Nothing here is hidden in a footer.”
Each source has one of three states. Ok: read recently. Stale: a copy is held and it is older than it should be. And a third, which most software pretends does not exist: could not look. The code is firm that this is “a third answer”, not a kind of failure and certainly not a kind of success.
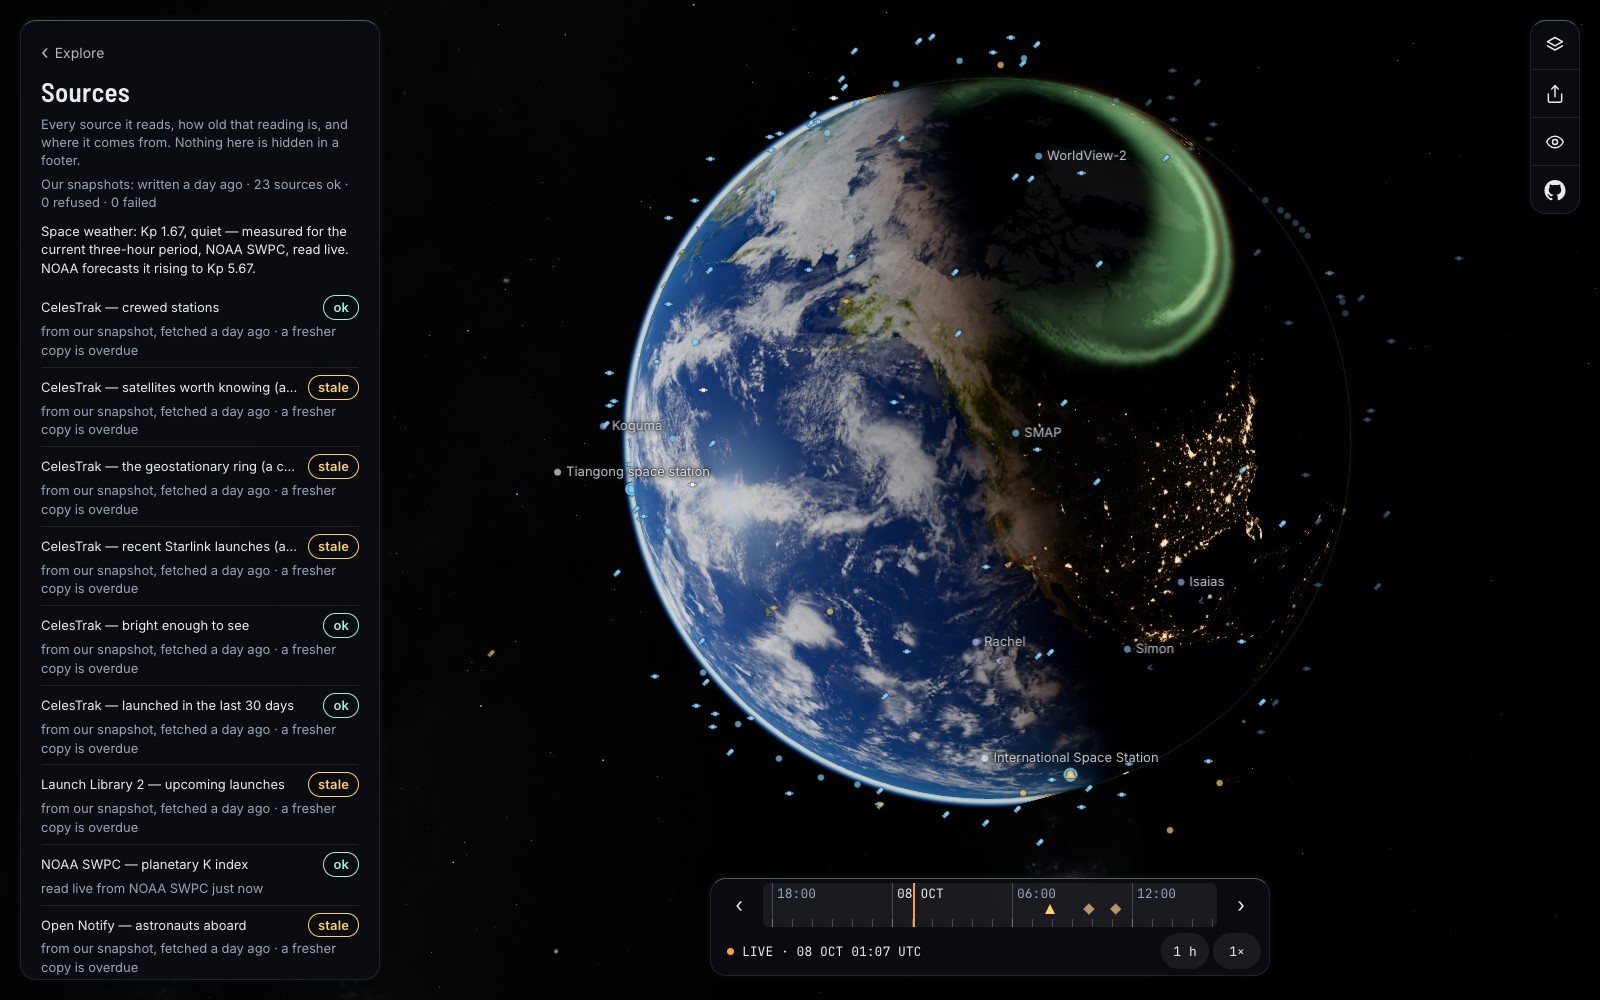
I chose that screenshot on purpose. On the morning I took it the saved copies were a day old, and five sources, among them the one that counts the people living in orbit, were marked stale. The project’s public issue list has an entry about exactly this, the live site falling behind and its copies ageing. I would rather show you the panel on a bad day, because a status page that is only ever green is telling you nothing.
Check it, then correct it#
Here is how to audit any number on the map in about a minute. Open the object. Read the last line of its card for the age. Open “Sources for this record” for the publisher. Then go to the publisher, which is always a public site, and look the object up there.
If the two disagree, the project wants to hear. The list of every source the map reads is a text file, with the address of each and how often it may be asked. The credits list every licence. And there is a form for reporting a wrong number that asks four things: which object, what the map says, what is correct and who says so, and when you saw it. Its first line is the project’s whole attitude in a sentence: “Getting it right matters more to this project than anything else.”
Start with Vanguard 1, if you like. A small satellite, launched in March 1958, still going round. Find the debris view and read the sentence about it. Then ask it the question you should ask every number about the sky: who says?
Questions people ask
How accurate is satellite tracking on public websites?
For a low orbit, about a kilometre near the time the orbit numbers were made, getting worse by roughly a kilometre a day. It is good for finding a satellite in the sky and not good enough for predicting collisions.
Where does satellite tracking data come from?
Radars and telescopes run mainly by the United States Space Force track objects and publish their orbits. CelesTrak and Space-Track distribute them, and trackers compute positions from those numbers.
How many satellites are in orbit?
It depends on who counts and when. In October 2026 CelesTrak’s catalogue listed about 17,000 working satellites among 34,570 tracked objects; ESA’s figures from July 2026 give about 15,900 working.
Are the pictures on Space Radar real photographs?
Some are. Thirty nebulae and galaxies and two black holes are real images with their credit shown. Planets wear maps made from spacecraft pictures, and anything illustrative or false-colour is labelled.
Sources
- GitHub github.com
- The oldest artificial object orbiting the Earth nasa.gov
- Defines such a set space-track.org
- CelesTrak celestrak.org
- Publishes its own figures sdup.esoc.esa.int
- What licence eso.org
- Spaceradar.ai spaceradar.ai
- Arxiv.org: 1002.2277 arxiv.org
- Nasa.gov: spot the station nasa.gov
- Astronexus.com: hyg astronexus.com
- Cosmos.esa.int: hipparcos cosmos.esa.int
Explore on Space Radar
Keep reading
A live satellite map that tells you when it is guessing
Space Radar draws everything in orbit where it really is, for people who have never heard of an orbital element. Why I think a map of space has to be honest and kind at once, what that costs, and why it is free and open.
Free planetarium software for a classroom with no Wi-Fi
Nearly half the world’s schools are not online. Space Radar is built so that one of them can keep its own copy on an old laptop and teach the sky from it. How that works, what a lesson looks like, and what it honestly cannot do without a network.
A virtual space tour that begins with a family photo
A map with a legend tells you everything at once. A guide tells you one thing, then the next. On the 26 narrated trips in Space Radar, how they are written, and three of them retold.