
Space Radar 2.0.0: What’s New in the Free 3D Map of Space
Stand on the Moon and Mars, read the sky stories of eight peoples, fly among 2.4 million more stars and watch them drift for ten thousand years, and make your own flights, films and paper models. The short tour of the biggest release yet, and what it still does not do.
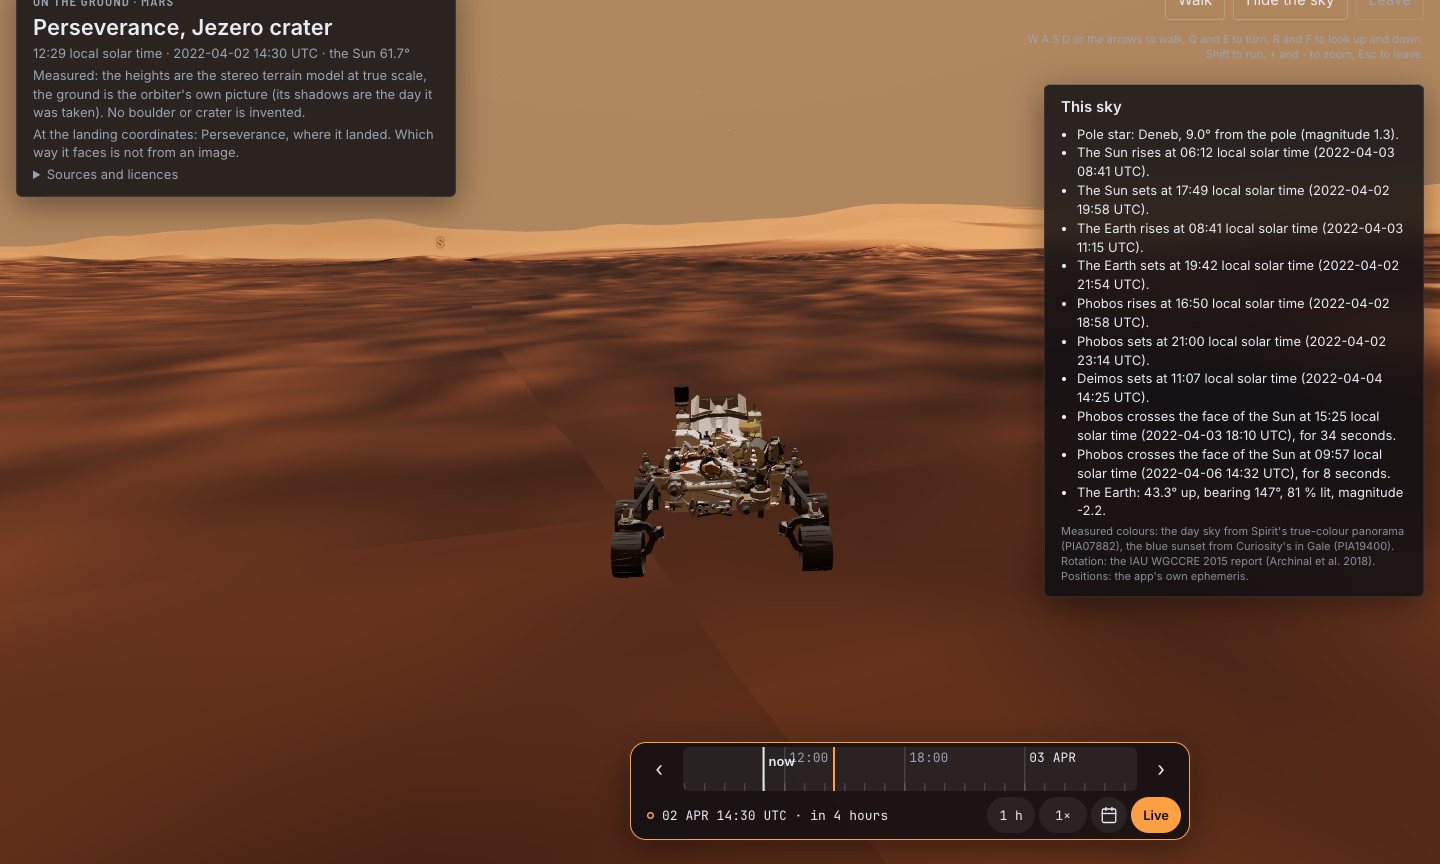
Driving Perseverance in Jezero crater. The ground is HiRISE’s height model; the rover goes about 95 times faster than the real one, and the stage says so.
Space Radar 2.0.0 is the biggest release so far of the free, open-source 3D map of space. You can now stand on the real ground at eight landing sites on the Moon and Mars, look up at the sky from six other worlds, read the constellation stories of eight sky cultures, run the sky 100 000 years either way to watch the stars drift, fly among 2.4 million more stars in 3D, find satellites by country and planets by size, try fifteen new simulators built on real data, and make your own camera flights, videos, dome shows and paper models. It runs in a web browser, on a phone too, with no account and no ads.
The release started with a look at four other space apps, SpaceEngine, Solar System Scope, Cosmoscope and CosmosMap, and a list of everything they did better than we did: 28 features. 2.0.0 builds them without giving up the map’s one rule, that every number says whether it was measured, modelled or drawn for illustration. This is the short tour; each section links to a longer article.
Stand on the Moon and Mars#
Open Apollo 15’s landing site and you stand at eye height a few paces from the Lunar Module’s descent stage, with Mons Hadley Delta rising to the south. There are eight sites, from Apollo 11 to Perseverance’s Jezero, on the stereo height models measured from orbit (LROC on the Moon, HiRISE on Mars), and no boulder or crater is invented.
You can also look up: the skies of the Moon, Mars, Titan, Europa, Proxima b and TRAPPIST-1 e are worked out for the place and moment, and from Jezero Phobos crosses the Sun as Perseverance filmed it in 2022. Read more: walk on the Moon and Mars in 3D.
The sky as other peoples saw it#
Tap a star in the sky view and its figure is named; press again and its story opens. There are 474 figures in eight sky cultures, modern western, Chinese, Māori, Hawaiian, Samoan, Tongan, Boorong and Norse, and 468 have a story, mostly from each culture’s own description in Stellarium. Read more: constellations in other cultures.
The bubble round the Sun#
The heliosphere, the bubble the Sun’s wind blows in the gas between the stars, is drawn once you are past 50 times the Earth’s distance. Its shells are published model shapes, labelled “modelled”, scaled to pass through the four points where Voyager 1 and Voyager 2 actually crossed its edges. A ladder rung and a trip stop take you there. Read more: what is the heliosphere?
Stars that move, stars that dim#
A new Deep time row in the sky view runs the clock up to 100 000 years. Bright and fast stars move as Hipparcos and Gaia measured them, so the Plough bends, Barnard’s Star swings past at 3.77 light-years in about the year 11 700, and a readout names the pole star of the day: Thuban in 2800 BC, Vega near AD 13 700. The same motions move the 3D star map and the stars behind the Earth, worked out on the graphics card.
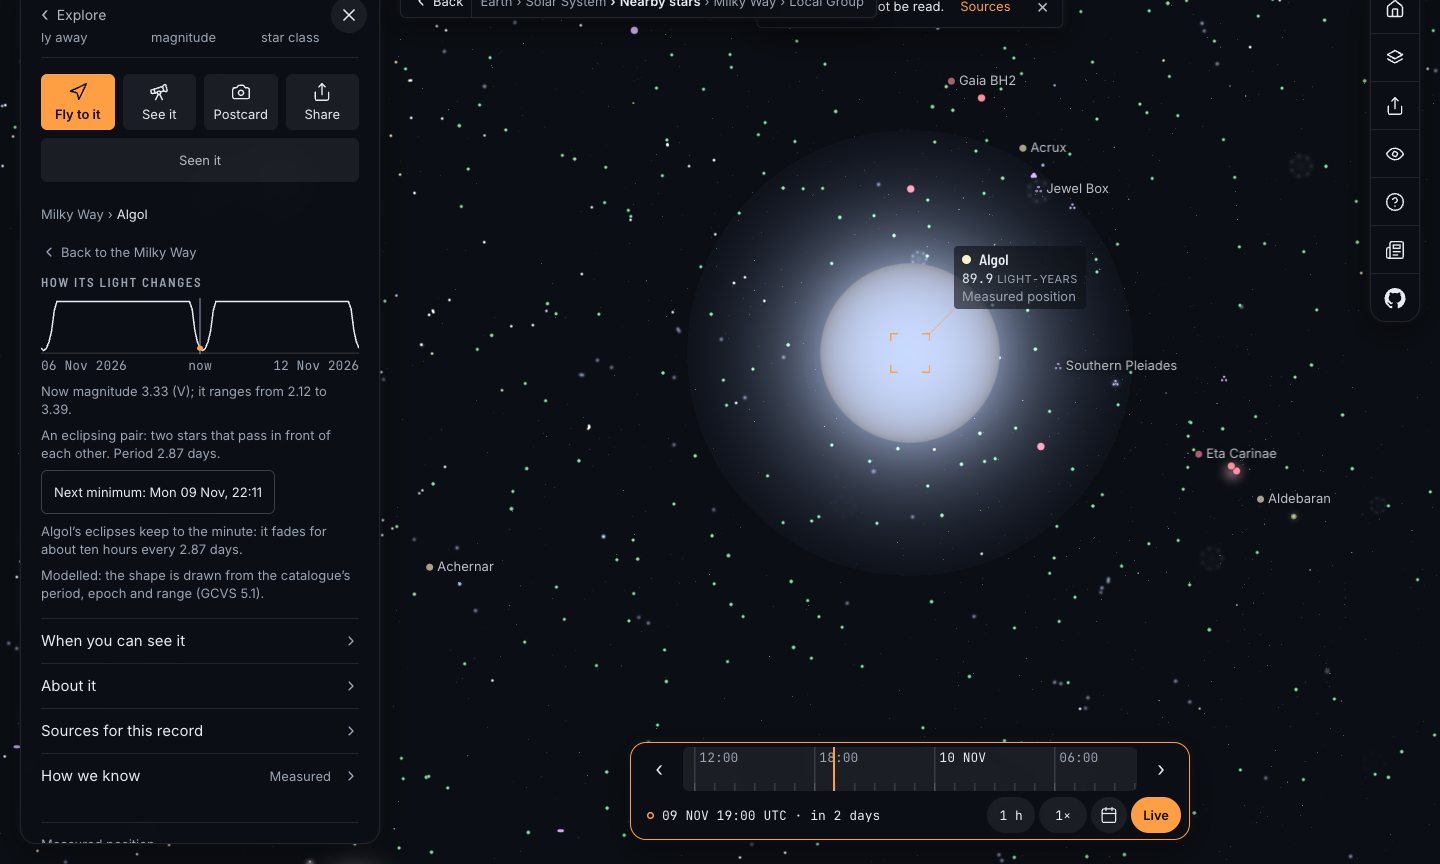
Fifty-eight variable stars now change brightness with the clock, from the General Catalogue of Variable Stars. Algol dims every 2.87 days, Mira swings from magnitude 2 to 10, and Betelgeuse on 15 February 2020 is as faint as it was in its Great Dimming. Each card has its light curve and, for an eclipsing star, the next minimum. Tonight’s list now tells you when Algol is at minimum from where you are. Read more: how the night sky changes over 10 000 years.
Two and a half million more stars#
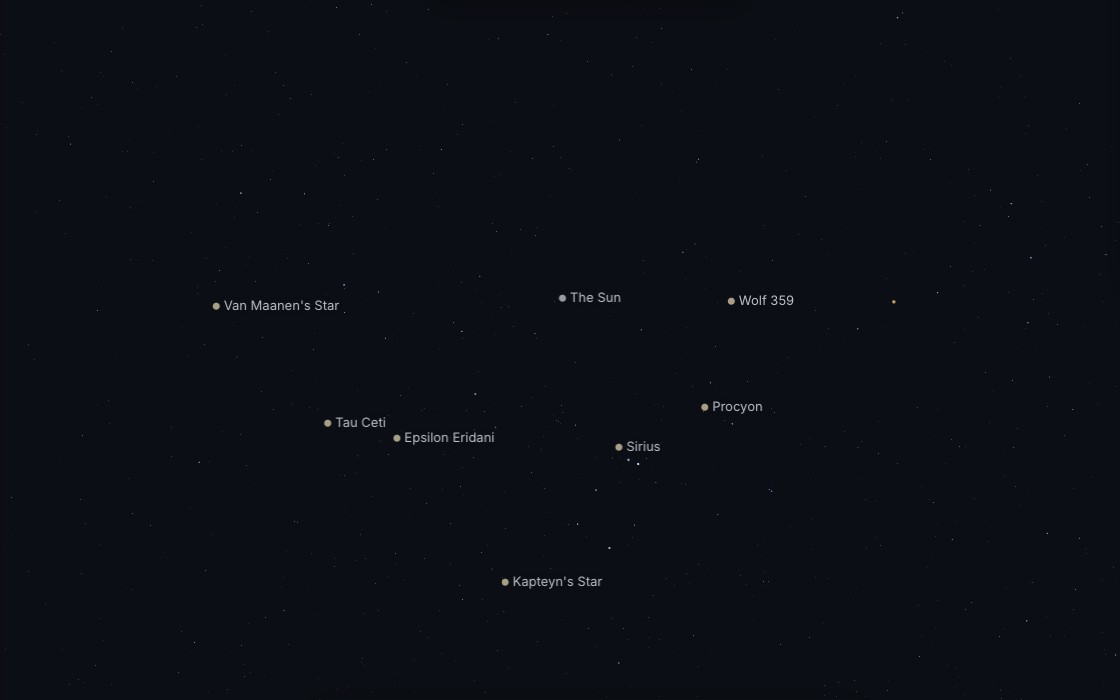
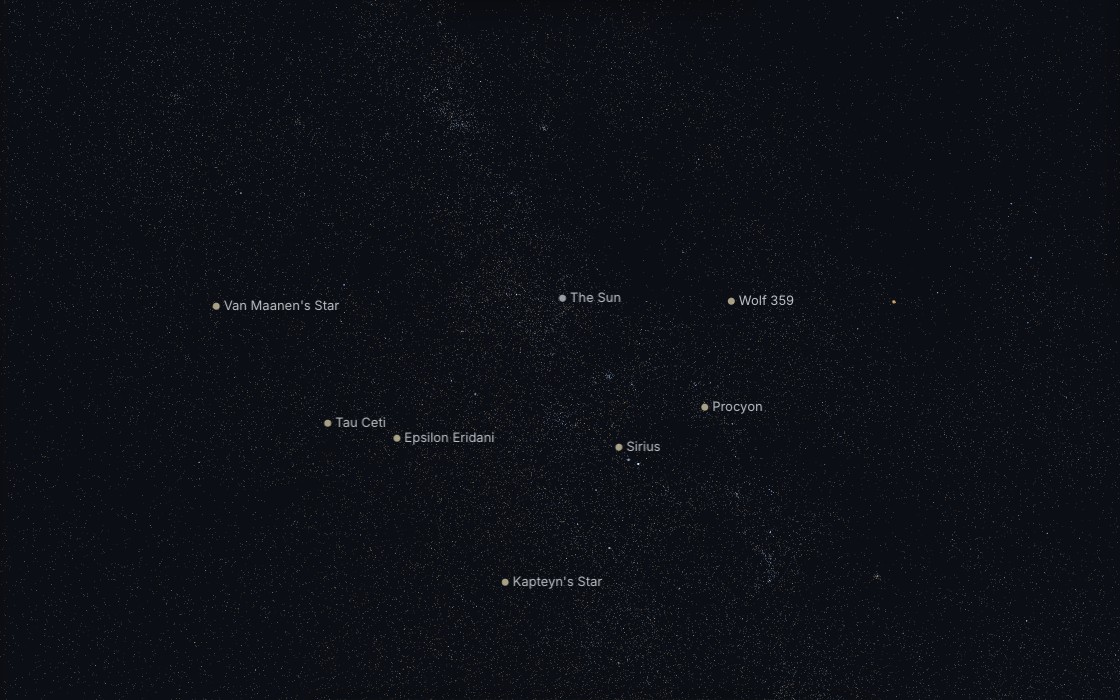
The 3D star map now adds 2 411 200 stars from the AT-HYG v4.0 catalogue (CC BY-SA 4.0) to HYG’s 109 389. They stream in by octree tile after the first frame, and the quality setting decides how many: HYG alone on Low or data saver, 40 tiles on a phone, 128 or 256 on a desktop. They are drawn to magnitude 11.5, past what an eye sees, so from 50 light-years out the Milky Way’s band appears. A tapped star’s card names its catalogue and a modelled distance error, and past 3 kiloparsecs it calls the distance a guess. On a far clock the view goes back to HYG’s stars, and a line says so.
Black holes that spin#
M87* and Sagittarius A* are now drawn turning: their shadows have the exact outline a spinning black hole casts, worked out by Bardeen in 1973. The spins are chosen, not measured, and the cards say so. A new button sets each one beside the Event Horizon Telescope’s own pictures, seen from Earth with north up, with a plain paragraph on what matches and what does not. Read more: M87* and Sagittarius A* next to the EHT images.
Fifteen new simulators, tagged for the classroom#
The Lab grows to 105 simulators. Seven of the fifteen new ones are built on real measurements, from a Hubble diagram of 740 supernovae to COBE’s spectrum of the Big Bang’s afterglow. Every simulator is now tagged by age band and by NGSS, KS3, GCSE and IB statements. Read more: free astronomy simulations on real data.
Fengyun-1C, told on one clock#
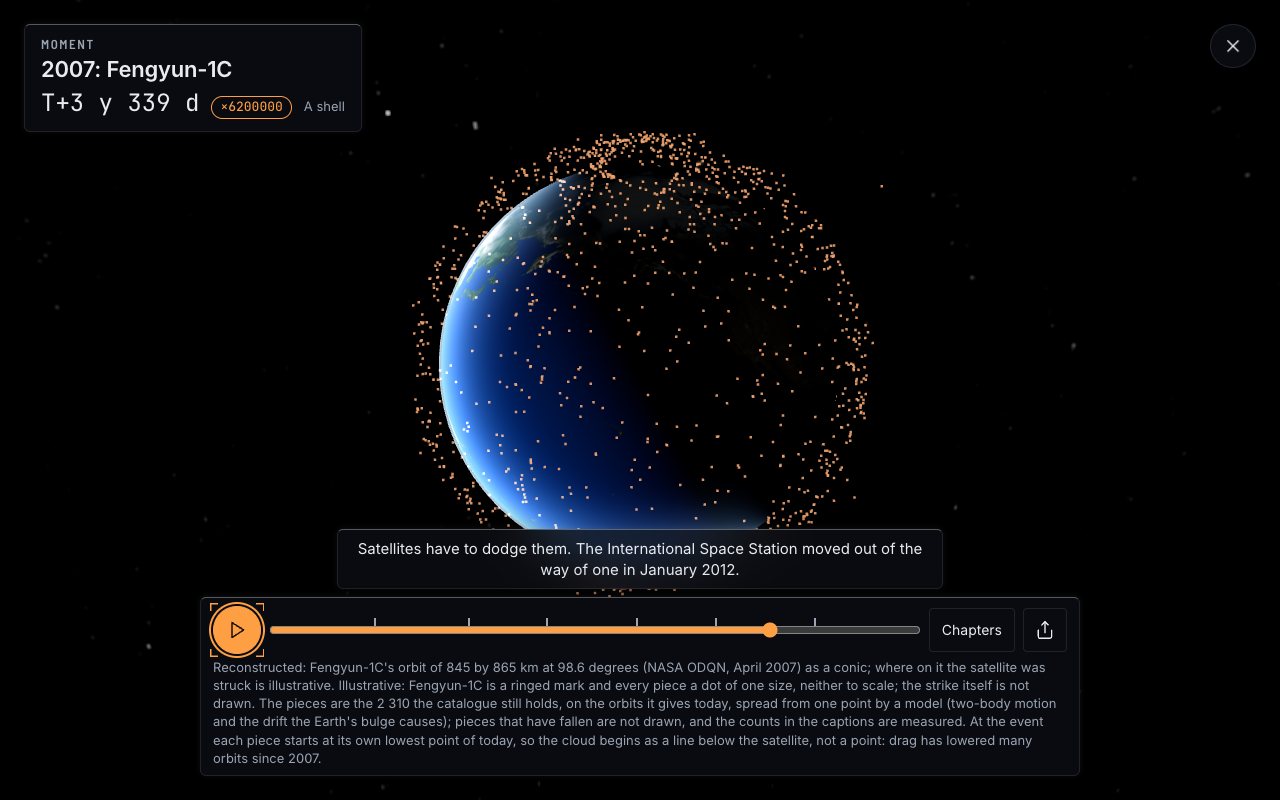
A new narrated Moment replays China’s anti-satellite test of January 2007: the strike, then the 2 310 pieces still in orbit spreading from a point to a ring to a shell round the Earth. Every count is measured; the spread is modelled, and the Moment says so. Read more: Fengyun-1C, the test that filled an orbit with debris.
Find anything#
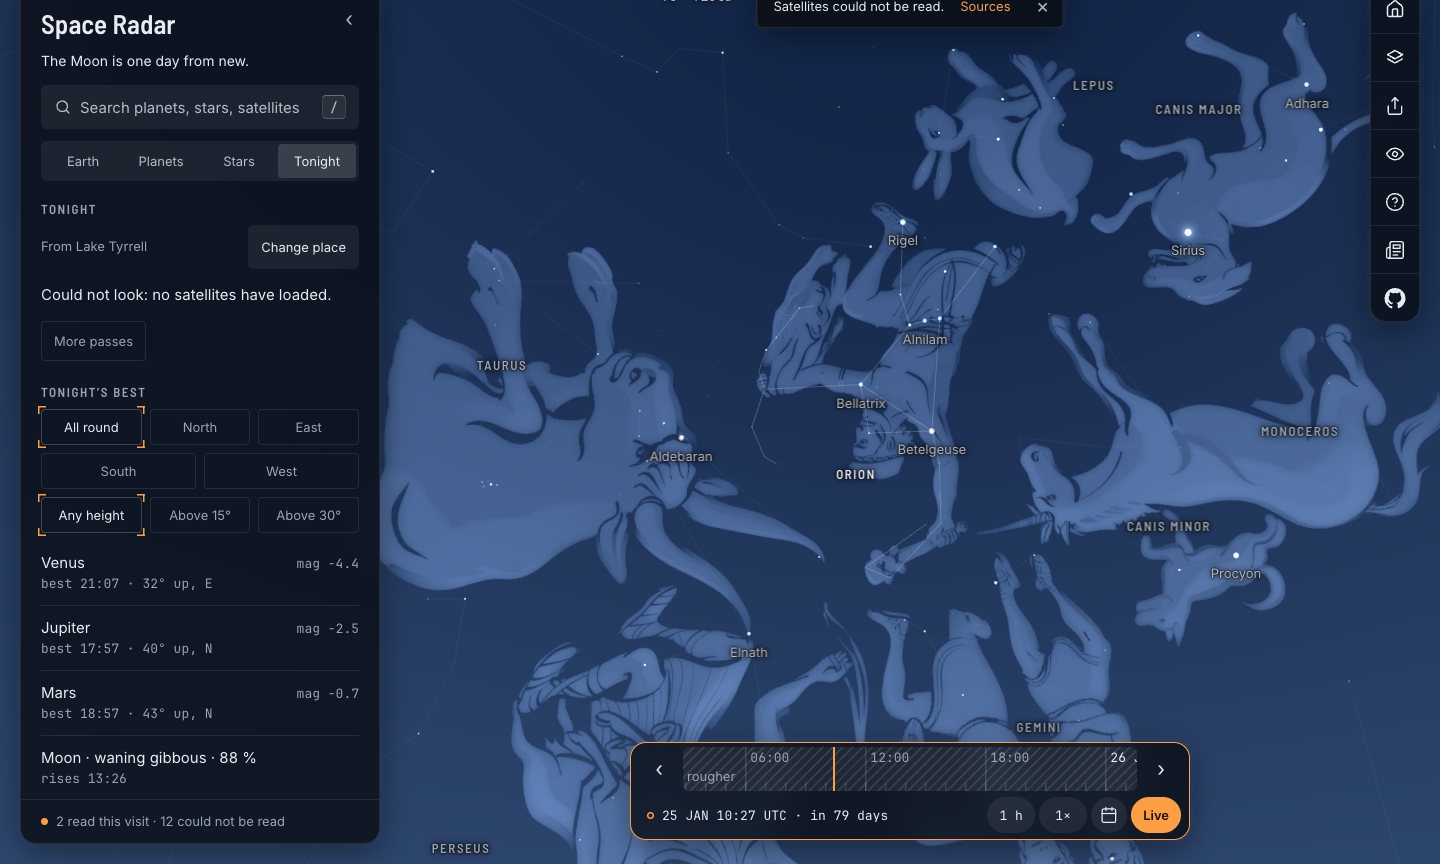
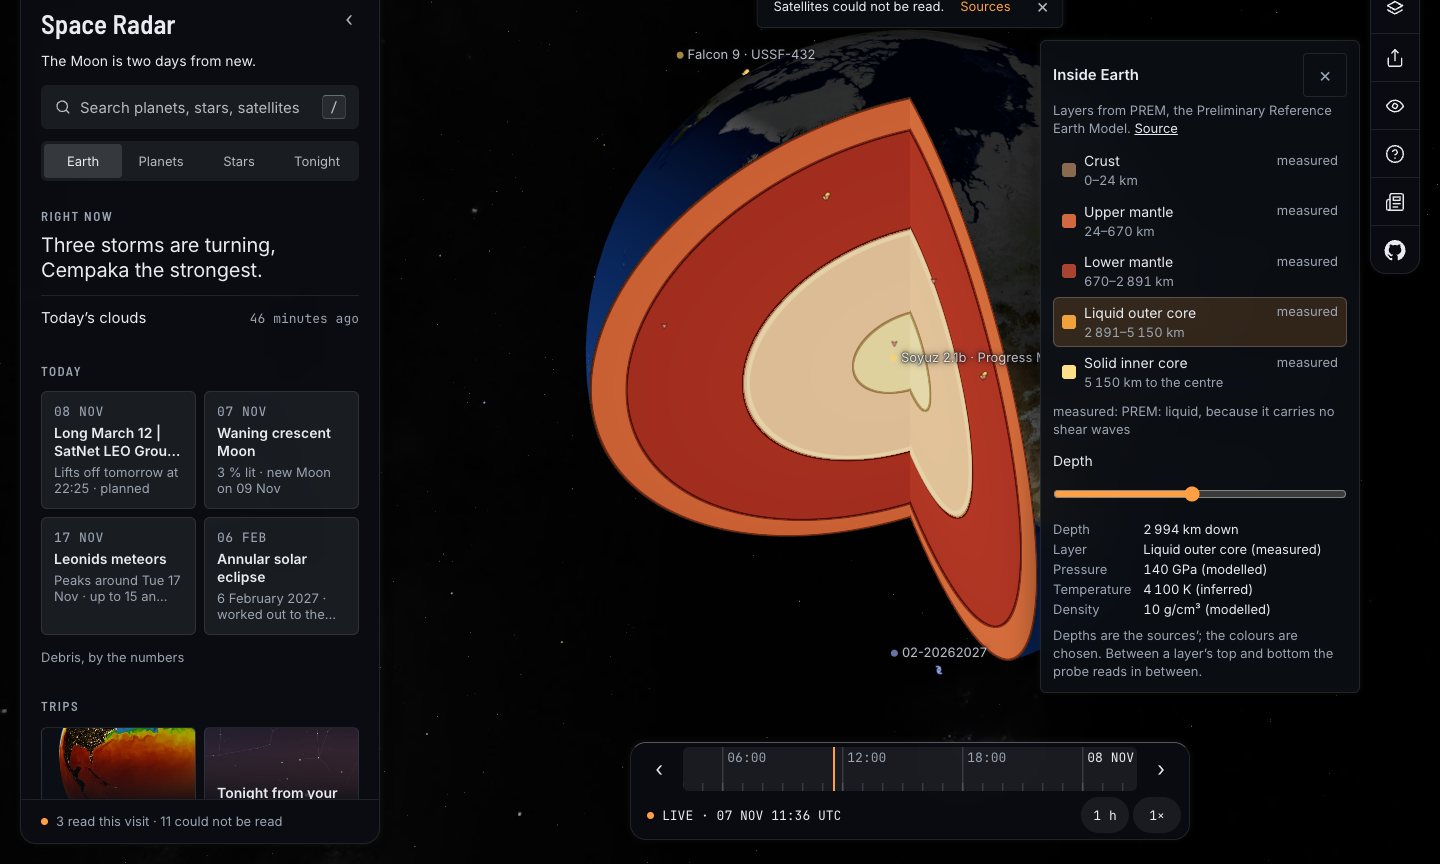
Find is a new table view. Ask for rocky planets in the habitable zone within 50 light-years and it lists 11; ask for India’s satellites and it lights them on the globe and names the missions with no public path. A date dialog takes “20 July 1969” or “next total eclipse”, from 1700 to 2200. Sixteen worlds can be cut open to their layers, and two sliders take the Solar System from true scale to a classroom orrery. Cards now quote the Wikipedia lead where we have no words of our own, and a Read aloud button speaks them. 68 of the 99 baked English cards are read in the trips’ synthetic voice; the other 31, and every other language, use your device’s speech. Read more: find satellites by country and exoplanets by size.
Make your own#
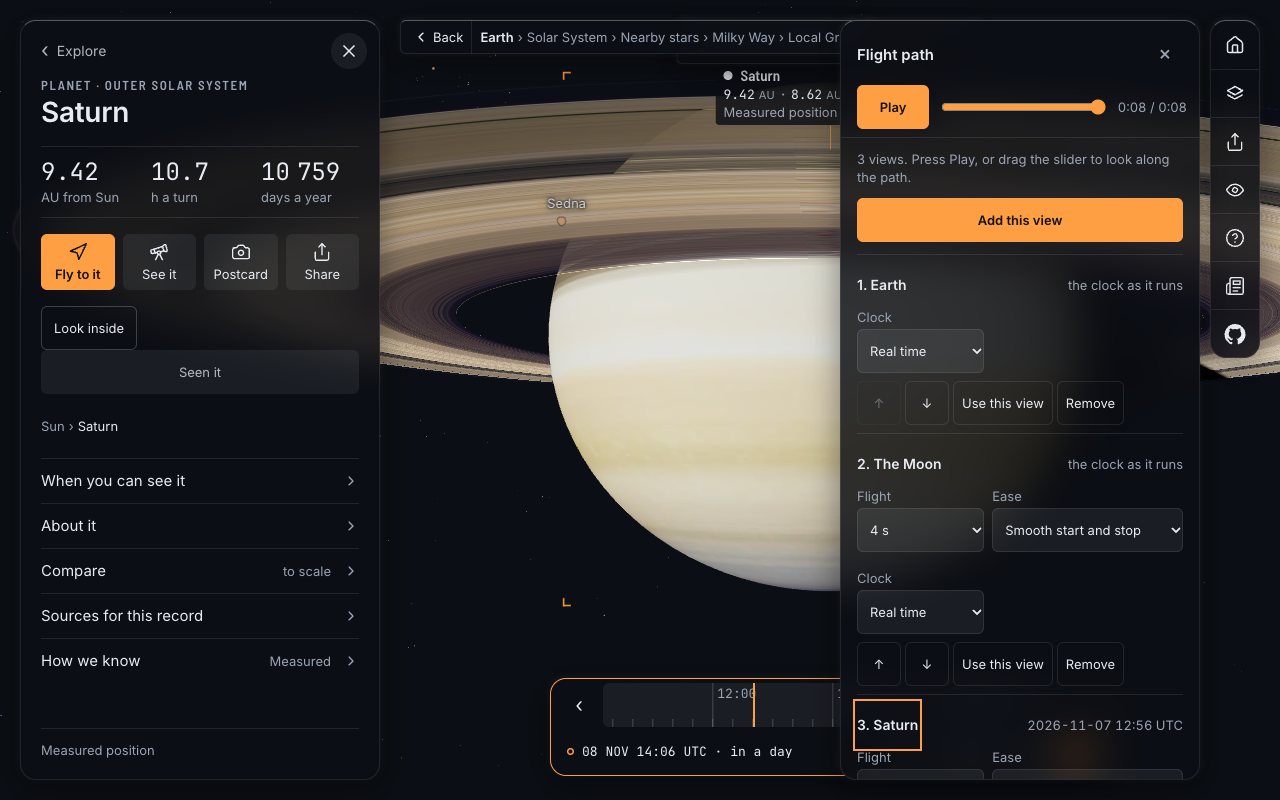
Share now plans camera flights you can send as a link, records video of any view or trip, and renders planetarium dome masters, 360-degree frames and skyboxes. The print page has 35 sheets, including paper globes of 32 worlds and a fold-up James Webb Space Telescope. A gamepad flies the map, and a WebXR headset mode lets you step inside. Read more: make your own space video, flight path or dome show.
Sound, models and the rest#
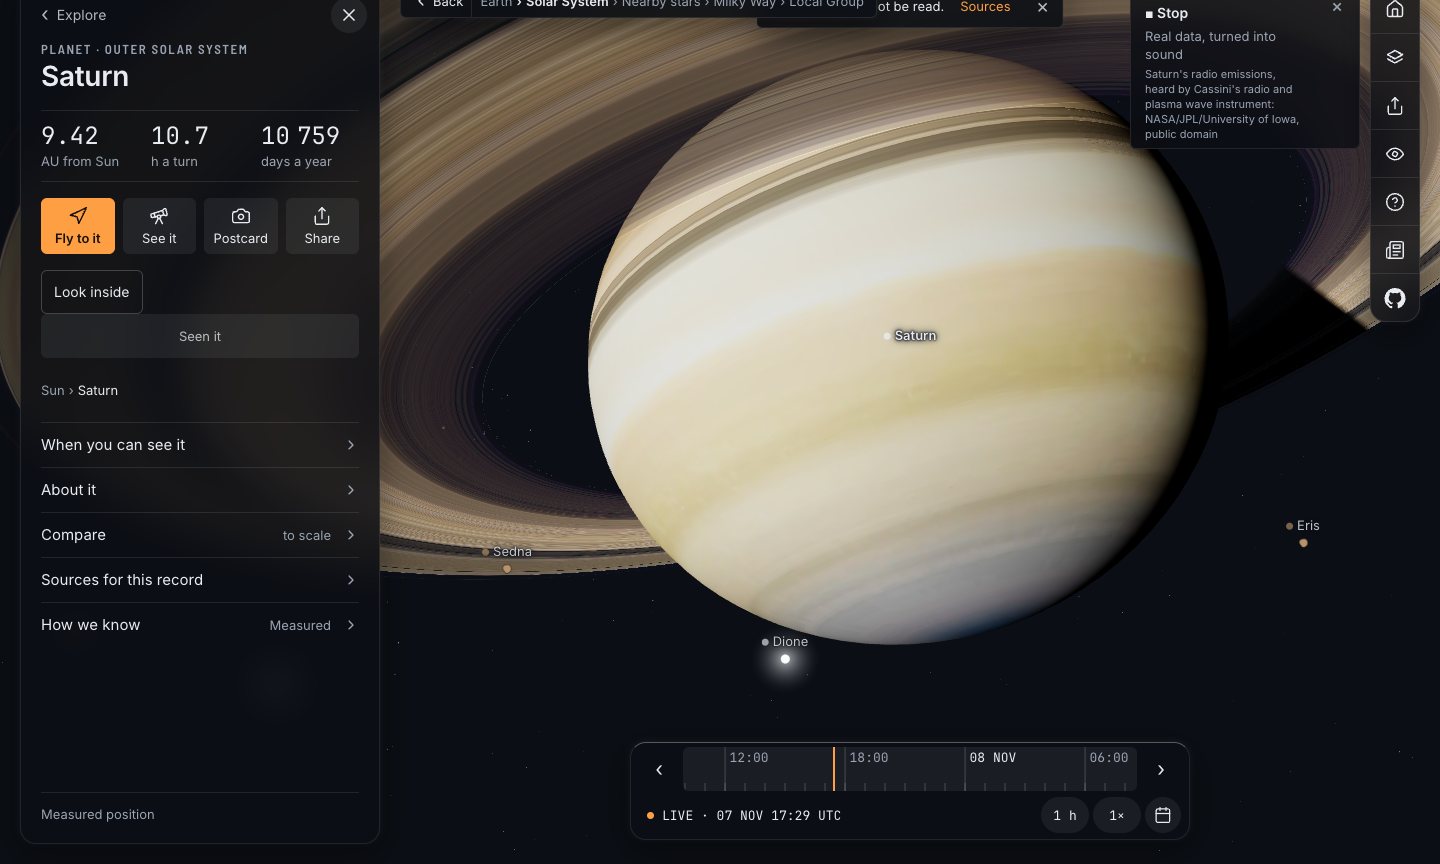
With sound on, the music changes as you climb outwards, and in six places a panel offers a real recording, such as Cassini’s radio at Saturn or InSight hearing the Martian wind, each marked “real data, turned into sound” or “real sound, from a microphone”.
Nine families of geostationary satellite buses now have models of their own, reaching 157 satellites that shared one stand-in. They are drawn from makers’ renders and published sizes, not blueprints, and their cards say so. The big constellations, Starlink’s V2 Mini, Kuiper, Qianfan, Guowang and Iridium NEXT, wait for a later release: we found no pictures good enough to draw them honestly.
There is also an asset pack of 194 spacecraft models and 10 maps the project made, a page for creators that allows commercial use of the footage with a credit, and five comparison pages that start with what the other apps do better.
Also in 2.0.0#
- The sky calendar runs to December 2028.
- The paths of the Webb telescope and Juno run on again, with the planned part marked on their cards.
- Deep-sky cards say what an object is in the visitor’s language, German included.
- Keyboard shortcuts leave text fields alone, and tap targets on a phone are at least 44 pixels.
What it does not do yet#
- Much of the new work was tested only in headless Chrome: the headset mode not on a real headset, the gamepad not with a real pad, the recorder not on a real phone, Safari or Firefox.
- The ten translations are machine-drafted and await native speakers. Constellation stories and the Lab are in English only.
- There are no Gaia DR3 stars: Gaia’s licence is CC BY-NC 3.0 IGO, which cannot go into a CC BY-SA app, so the new stars are AT-HYG’s.
- Spacecraft orbiting a planet are not moved out with it when the Size slider enlarges the planet.
The code is on GitHub, under the MIT licence; if something is wrong, say so there. Start with the ground: stand at Hadley, turn round, and then look up.
Questions people ask
What is new in Space Radar 2.0.0?
Walkable terrain at eight Moon and Mars landing sites, skies of six other worlds, constellation stories from eight cultures, the heliosphere, 2.4 million more stars in 3D from AT-HYG, stars that move over millennia and 58 variable stars, spinning black holes, 15 new Lab simulators, a Fengyun-1C debris Moment, Find by country and property, a date dialog, planet cutaways, size and distance sliders, a flight editor, video recording, dome and 360 output, paper models, gamepad and headset support.
Is Space Radar free?
Yes. It is open source under the MIT licence, runs in a web browser, with no account and no ads, and it counts no visits.
Does Space Radar work on a phone?
Yes. It uses WebGL, which most phones support. On an emulated mid-range phone over slow 4G, the first frame arrived in about 8.4 seconds when measured on 7 November 2026; the heavier features load only when opened.
How is Space Radar different from SpaceEngine?
SpaceEngine is a desktop program for Windows that lets you land anywhere on procedural worlds and fly with Newtonian physics. Space Radar runs in a browser, draws only real or clearly labelled objects, and adds live satellites, sky events and narrated trips. Its comparison page lists what SpaceEngine does that Space Radar does not.
How do I know what is measured and what is modelled?
Every record, panel and stage carries a label: measured, modelled or illustrative. The heliosphere, the far-future sky and the debris spread, for example, are marked as models, while the Voyager crossings and debris counts are marked as measured.
Sources
- Space Radar changelog github.com
- LROC NAC digital terrain models Arizona State University / NASA LRO
- HiRISE digital terrain models University of Arizona / NASA MRO
- Stellarium sky cultures Stellarium
- NASA’s Voyager 2 probe enters interstellar space NASA
- General Catalogue of Variable Stars (VizieR B/gcvs) CDS
- Event Horizon Telescope EHT Collaboration
- Orbital Debris Quarterly News 11(2): the Fengyun-1C test NASA
- CelesTrak satellite catalogue CelesTrak
- NASA Exoplanet Archive NASA / Caltech IPAC
Explore on Space Radar
Keep reading
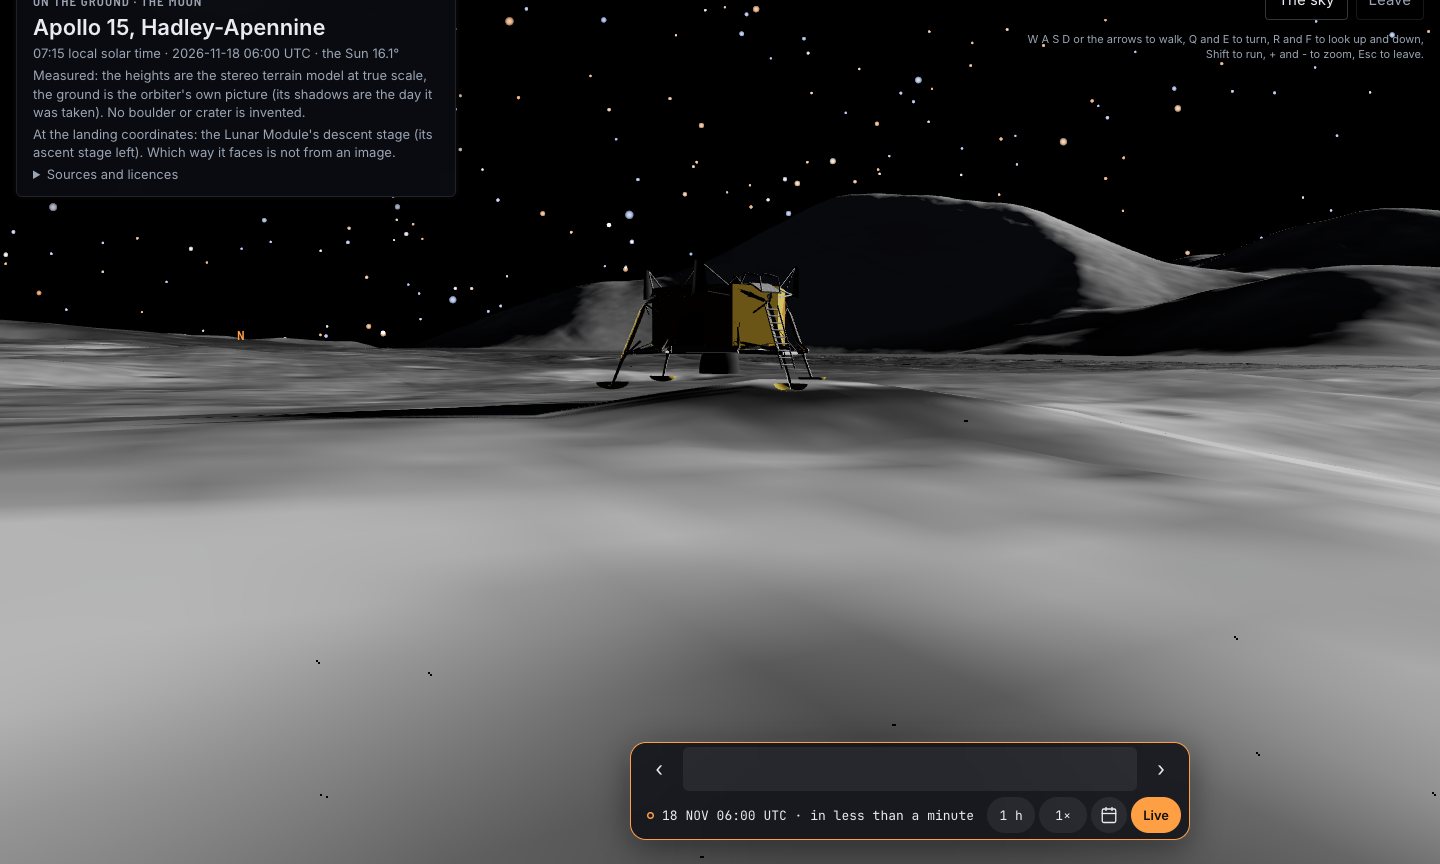
Walk on the Moon and Mars in 3D: the Real Ground at Eight Landing Sites
Stand where Apollo 15 landed, drive Perseverance across Jezero, then look up and watch Phobos cross the Sun. Eight landing sites built from orbiters’ height models, and the skies of six other worlds.
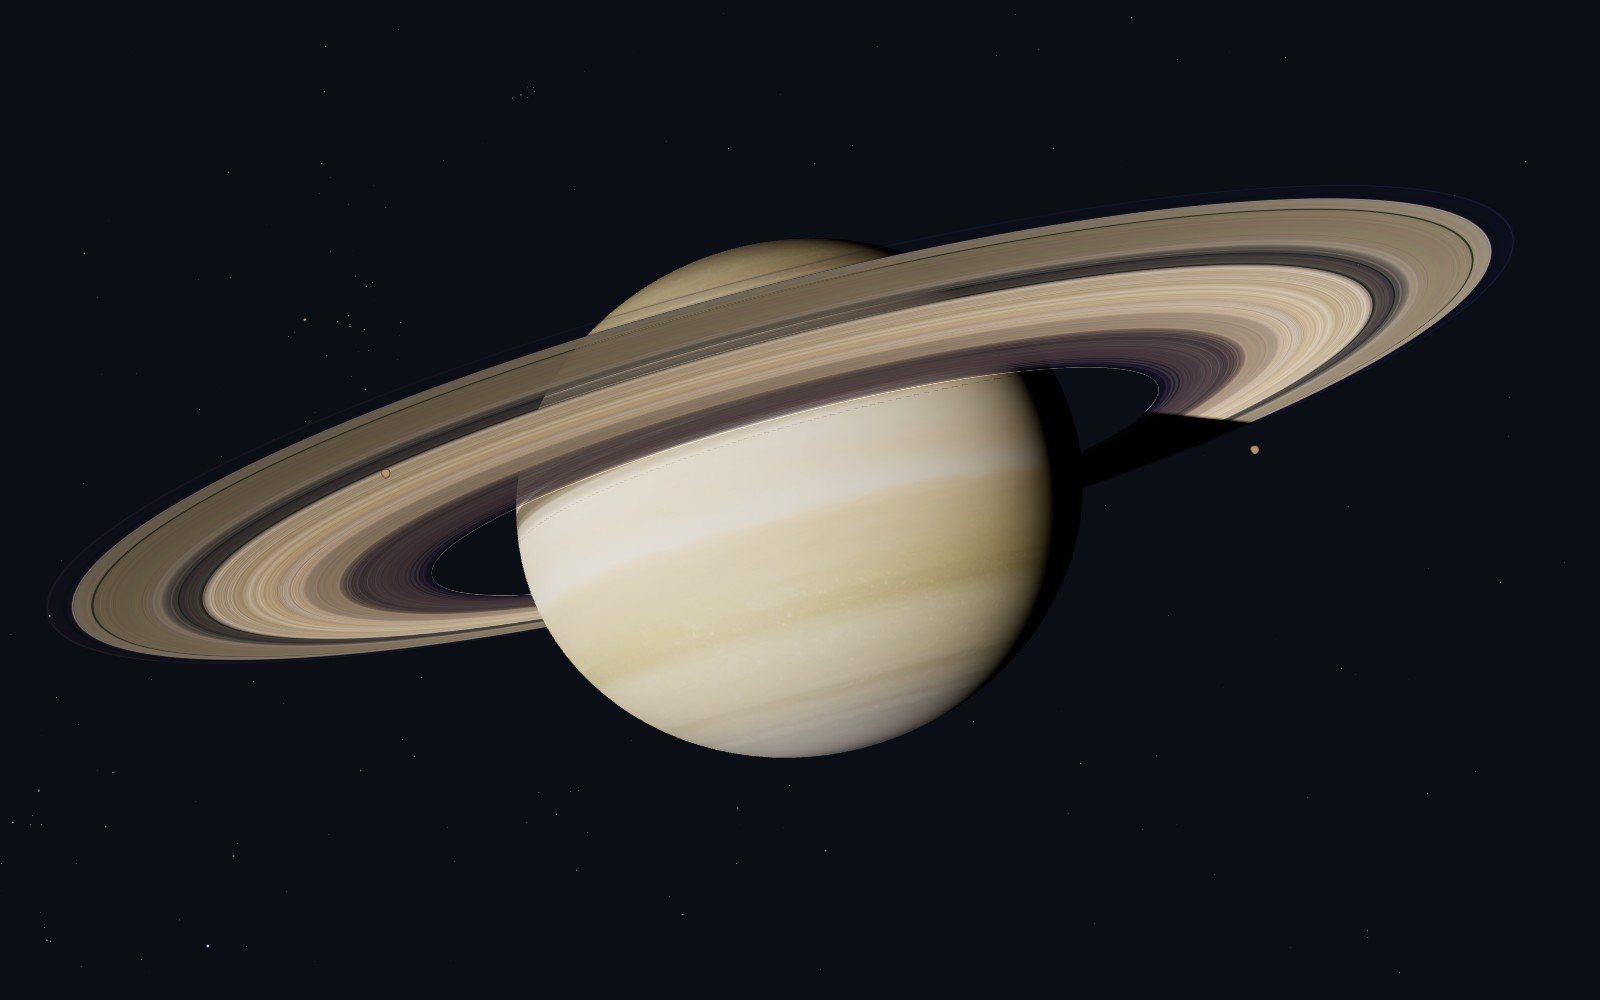
A live satellite map that tells you when it is guessing
Space Radar draws everything in orbit where it really is, for people who have never heard of an orbital element. Why I think a map of space has to be honest and kind at once, what that costs, and why it is free and open.
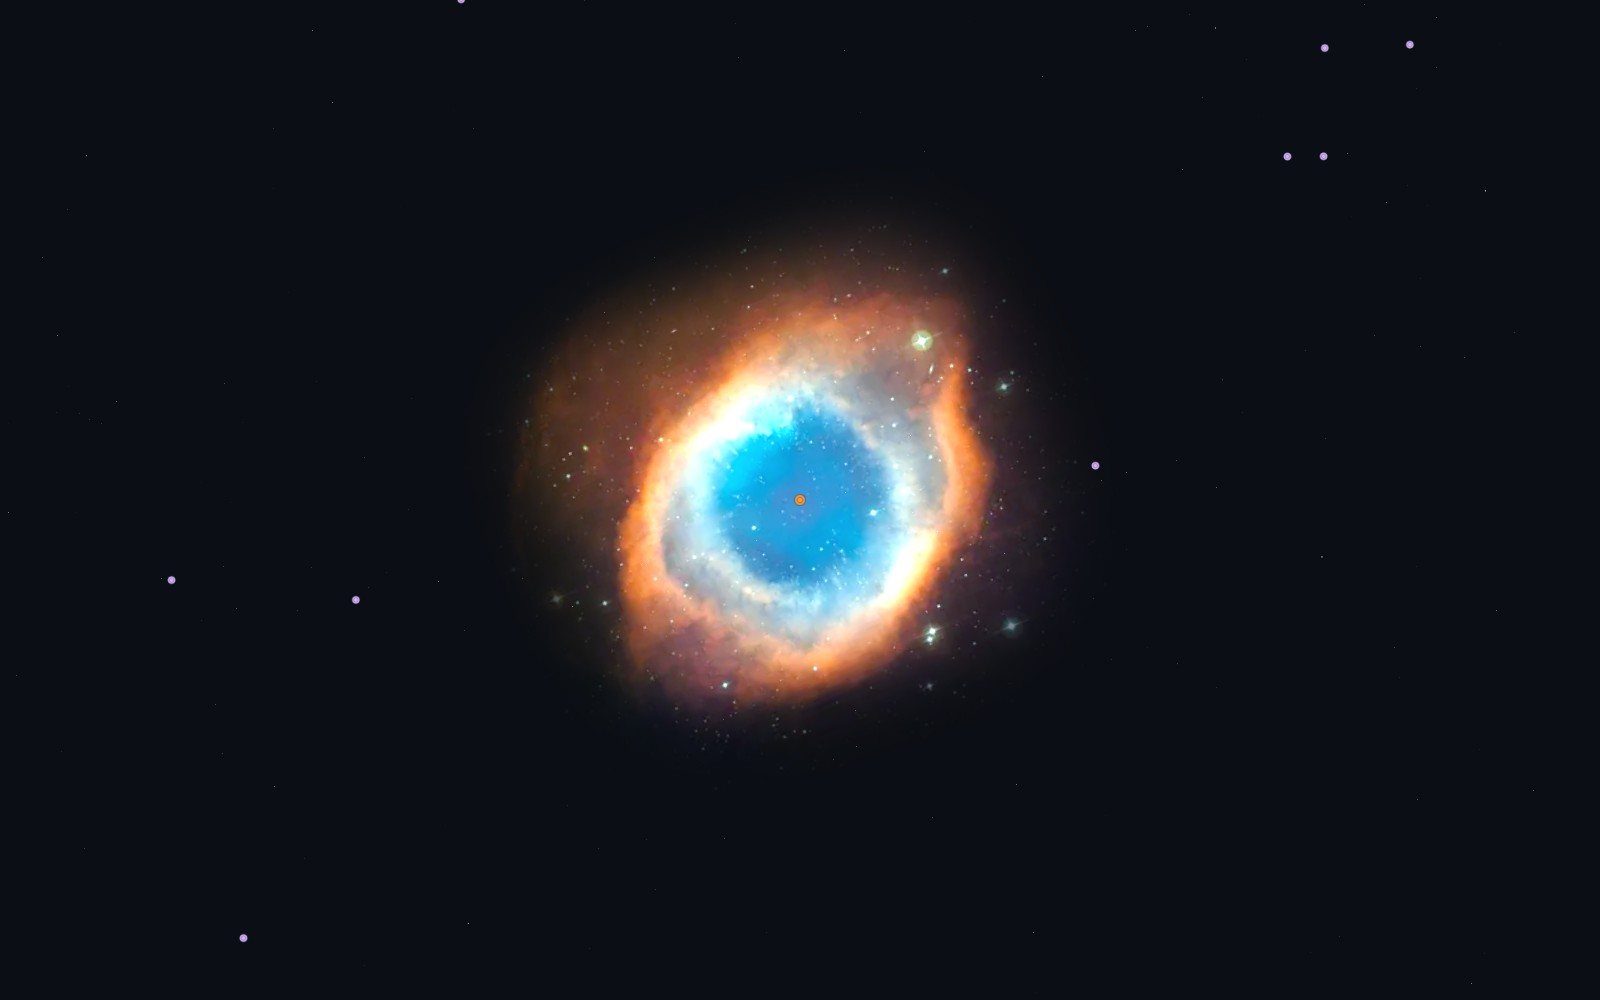
A virtual space tour that begins with a family photo
A map with a legend tells you everything at once. A guide tells you one thing, then the next. On the 26 narrated trips in Space Radar, how they are written, and three of them retold.